


Summary
Directional results, Thellier-type palaeointensity determinations and Ar/Ar ages are presented from volcanic units of Pleistocene age from the Hawaiian islands of Maui and Lanai. Twenty-nine non-contiguous lava flows were sampled on Lanai. The lava flows formed during the late Matuyama polarity chron about 1.6 Ma and recorded the Gilsá geomagnetic polarity excursion. The obtained ages of 1.6 Ma for the Lanai lavas are significantly older than ages previously obtained for this island. These new ages are, however, in agreement with the age progression of the Hawaiian hotspot. The palaeomagnetic record over the sampled succession is characterized by reversed and intermediate directions. palaeointensities are generally very low, about half the present-day field intensity, dropping to values of ∼5 μT during transitional field states. Transitional virtual geomagnetic poles (VGPs) from Lanai are situated first near the west coast of South America and then switch to offshore western Australia. Normal polarity is never reached in the sampled succession. Transitional VGPs located close to Australia accompanied by relatively low palaeointensities are found in most records of short geomagnetic excursions during the Matuyama polarity chron (e.g. the Cobb Mountain subchron, the Punaru event and the Matuyama/Brunhes precursor) suggesting very similar physical processes likely related to dipolar dominance during the onset of these excursions and influences of lower mantle heterogeneities. Approximately 800 kyr after the Gilsá excursion, lava flows on Maui recorded the last reversal, the Matuyama/Brunhes transition. Fourteen lava flows were sampled which recorded the pre- and post-transitional behaviour of the Earth's magnetic field. The geomagnetic field intensity is low prior to the reversal, approximately 8 μT, and increases strongly afterwards up to ∼63 μT. These values of about twice the present field intensity of Hawaii after the transition emphasize a strong asymmetry between pre- and post-transitional fields, which is particularly strong in the region of Hawaii.
1 Introduction
Palaeomagnetic investigations on Hawaiian lava flows began already in the early sixties with the seminal studies of Doell & Cox (1961, 1965). Numerous palaeomagnetic results were published since those early days on volcanic sequences from the Hawaiian islands, focusing on a wide range of different geomagnetic questions and ages of sampled units (e.g. Doell 1972a,b; Bogue & Coe 1984; Baksi et al. 1992; Mankinen & Champion 1993; Herrero-Bervera & Valet 1999; Bogue 2001; Laj et al. 2002; Teanby et al. 2002; Herrero-Bervera & Valet 2005). The high-extrusion rates of the Hawaiian shield volcanoes represent excellent conditions to investigate the transitional field behaviour during geomagnetic reversals and excursions. Studies of the transitional field behaviour were conducted on several different reversals recorded in Hawaiian lavas, starting with the last reversal, the Matuyama/Brunhes transition (Baksi et al. 1992; Coe et al. 2004b) up to reversals during the Gauss chron (Herrero-Bervera & Coe 1999) and the Gilbert chron (Bogue & Coe 1984). An important potential of volcanic records of the past geomagnetic field is the possibility to analyse the full palaeomagentic vector, that is, inclination, declination and absolute palaeointensity. For some of these transitional records, in particular the early Pliocene Kauai transition, palaeointensity determinations were conducted (Bogue & Coe 1984; Bogue 2001). Local palaeomagnetic records of directional and intensity variation during or close to transitional geomagnetic field states provide essential information regarding a global interpretation of the reversal processes and, therefore, the understanding of the mechanisms within the geodynamo. Particularly, on the Hawaiian islands, not only full geomagnetic reversals but also other transitional and non-transitional volcanic records were investigated using palaeointensity determinations. Such palaeointensity studies on Hawaiian lavas are now covering age ranges from the most recent lavas (Coe et al. 1978; Mankinen & Champion 1993; Yamamoto et al. 2003) to the Brunhes polarity chron (Laj & Kissel 1999; Laj et al. 2002; Teanby et al. 2002) up to the Pliocene lavas on Hawaii (Coe et al. 1984; Laj et al. 2000; Bogue 2001; Herrero-Bervera & Valet 2005) with a diminishing amount of gaps within the data set.
Here, we present volcanic records from two Hawaiian islands, Lanai and Maui, where full vector measurements were conducted. The Gilsá event (Wensink 1964; McDougall & Wensink 1966; Watkins et al. 1975) was sampled in a reconnaissance study on Lanai. It is still debated whether this event, which happened 1.61 Ma (Udagawa et al. 1999), should be referred to as a global normal polarity subchron or an excursion of the geomagnetic field (Clement & Kent 1987). Our Lanai record adds to a small collection of globally distributed records, and provides for the first time, absolute palaeointensity information for the Gilsá excursion.
On the island of Maui, the last full reversal of the Earth's magnetic field, the Matuyama/Brunhes transition was sampled in a volcanic sequence approximately 10 km south of the records of Baksi et al. (1992) and Coe et al. (2004b). Pre- and post-transitional directions accompanied by palaeointensity determinations were obtained from this sequence.
2 Geological Setting
The volcanic rocks of Lanai originate from a single shield volcano (Fig. 1a). They represent only the shield stage and consist of tholeiitic basalts (West et al. 1992) which formed presumably between 1.2 and 1.7 Myr (Bonhommet et al. 1977, this study). Younger ages of 0.7–0.8 Ma were obtained in Maunalei Gulch on the north coast of Lanai (Naughton et al. 1980). These ages are, however, affected by large uncertainties due to the small amount of radiogenic elements (Naughton et al. 1980). Normally magnetized lavas were found neither in our study, nor by Herrero-Bervera et al. (2000), who sampled eight sites from different places on Lanai, indicating volcanic activity occurred exclusively during the Matuyama polarity Chron. In a reconnaissance effort we took palaeomagnetic samples from 29 lava flows in the Kaumalapau gulch and along the road towards Kaumalapau harbour. The lava flows dip 5° in the upper part and 8° in the lower portion to the west. Lavas are predominantly of the Pahoehoe type. Only a few AA flows are observed. No evidence of block tilting, rotations or major unconformities was observed along the sampled profile. In the lower part of the profile (flows L-K2 to L-K11) there are between three and ten unsampled lava flows between each site. For flows L-K13 to L-K15 and L-K17 to L-K19, two to four flows were identified between the sites. In the upper part of the section (L-K22 to L-K28) adjacent lavas were sampled within Kaumalapau gulch. The stratigraphic relationship between site L-K11 and 12, L-K15 and 16, L-K21 and 22, as well as the stratigraphic position of sites L-K1 and L-K29 is not deducible from field observations since large parts of the sequence are covered by debris. Sampling distance/altitude and average lava dip correlations already suggest a possible recurrence of sampled successions. palaeomagnetic results support a repetition of parts of the sequence which will be discussed more precisely later. A single wollsack weathered lava flow was sampled close to the volcanic rift in the northcentral part of Lanai.
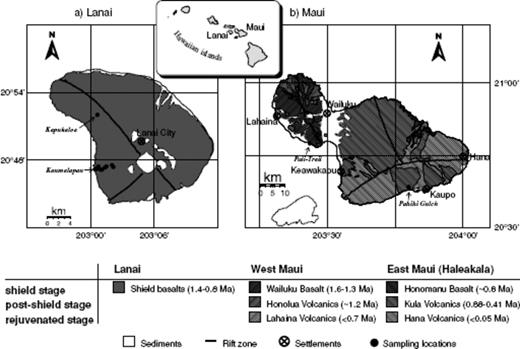
Geological sketch map of Maui and Lanai (Hawaiian Islands) according to Langenheim & Clague (1987). Filled circles indicate sampling locations on both islands. The given ages of the volcanic series are the oldest respectively youngest K/Ar determinations according to Naughton et al. (1980).
The island of Maui consists of two shield volcanoes, the younger Haleakala volcano (East Maui) and the older West Maui volcano (Fig. 1b). Three major units are defined on the West Maui volcano (Stearns & Macdonald 1942): the Wailuku series (shield stage), the Honolua volcanic series (post-shield stage) and the Lahaina series (rejuvenated stage). Palaeomagnetic samples from two lava flows were taken from the ∼1.6 Myr old (Naughton et al. 1980) Wailuku series. Three major units are also identified on the Haleakala volcano: the Honomanu, Kula and Hana series forming the shield, post-shield and rejuvenated stage, respectively (Stearns & Macdonald 1942). Samples were taken from the 0.41 to 0.88 Myr old Kula series (Naughton et al. 1980). Two profiles were sampled in the Pahihi Gulch on the southern side of the Haleakala volcano, which cuts through the stratigraphically lower part of the Kula series (Fig. 2). Profile M-PGA was sampled approximately 1 km north of Kaupo road within the gulch. 150 m north of M-PGA, closer to the Haleakala caldera and the supposed extrusion centre of the lavas, profile M-PGB was sampled. Despite the limited distance between the two profiles a direct flow-to-flow correlation is complicated. The lavas cannot be followed due to debris coverage and erosion within the gulch. Nevertheless, the presence of a prominent ash layer below flows M-PGA7 of profile A and M-PGB6 of profile B (Fig. 2), the similar composition and physical appearance of flow and ash layer, an occurrence in agreement with the overall average dip of flows in this area, and finally the almost identical palaeomagnetic results suggest a correlation marker. Based solely on palaeomagnetic data, a correlation of other lava flows of M-PGA to profile M-PGB is suggested as well (Fig. 2). These lavas are characterized by almost identical palaeomagnetic direction and palaeointensities, indicating a formation during a very short period of time. At first instance, however, both profiles will be analysed independently.
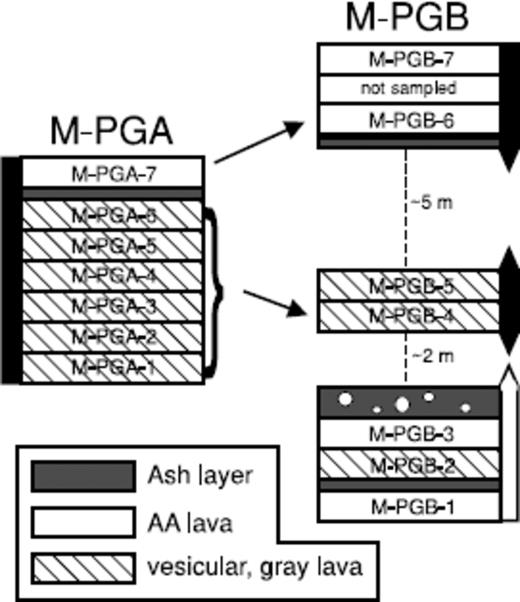
Stratigraphy of the two profiles sampled in the Pahihi Gulch, Maui. The suggested correlation between the two profiles is indicated by arrows. Also shown is the polarity of the flows.
The outcrops of profile B are partly covered by debris. Gaps are thus present in this succession. AA lavas (Fig. 2) are characterized by a massive interior part and a well defined scoria on the upper flow boundary. Vesicular flows also show a thin scoria on the upper part of the individual flow. The composition of the ash layers is dominated by fine particles with larger (Ø50 cm) lava blocks and bombs within the fine grained matrix. Three larger blocks of the ash layer superimposed on M-PGB3 were sampled and palaeomagnetically analysed. All three blocks revealed completely different palaeomagnetic directions, indicating a magnetization before deposition. The flow between M-PGB6 and M-PGB7 was not accessible for drilling. Fluxgate measurements, however, indicate normal polarity.
The thickness of the sampled lava flows from Maui and Lanai ranges between 0.4 and 3 m. All sampled lavas appear to be in situ. Therefore, no tectonic corrections were applied for analysing the samples. Sampling was conducted using a portable, water cooled drill. Whenever possible cores were drilled in the central part of the flow with horizontal spacings of at least 1 m between different samples. In order to avoid lightning strike remagnetized lavas the deflection of the compass needle was checked.
3 Palaeo- and Rock Magnetic Results
3.1 Rock magnetic investigations and ore microscopy
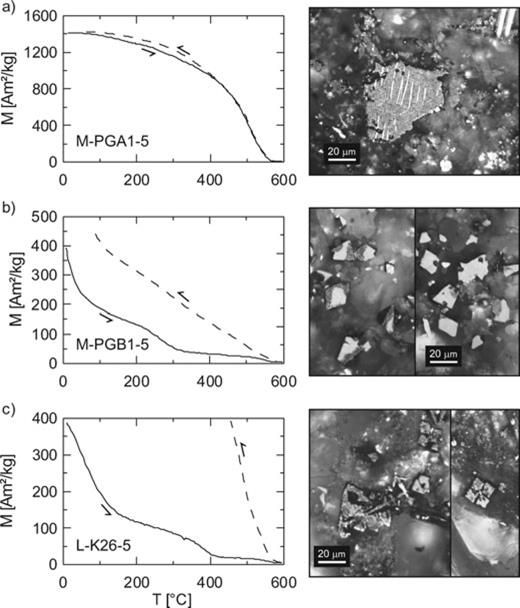
At least one sample from every flow was used for a set of standard rock magnetic measurements. IRM-acquisition, backfield curves, hysteresis loops at room temperature and thermomagnetic curves (Bmax = 500 mT, Tmax = 700 °C) were measured for each of these samples using a Variable Field Translation Balance (VFTB). A vertical profile of eleven evenly spaced samples from the bottom to the top of flow M-PGB3 indicates the presence of significant rock magnetic differences depending on the vertical position of the sample. Different rock magnetic properties are also observed for horizontally spaced samples from single lavas. Therefore, all rock magnetic measurements can be termed representative only for the sample in charge and not for the whole flow. Strong-field thermomagnetic curves [Ms(T)] point to the presence of several different magnetic phases in most samples from both islands. Wasp waisted hysteresis curves are common, particularly in the Lanai tholeiites. For these reasons, domain state and grain size analysis according to Day et al. (1977) is highly ambiguous and we refrain from interpreting such plots. Three characteristic TC-ranges are observed by Ms(T)-curves in all investigated samples. TCs between 500 and 580 °C are present in all specimens from Maui and Lanai. During thermal demagnetization similar high unblocking temperatures bearing a characteristic remanent magnetization are found, indicating that this high temperature phase did not exclusively arise from alteration during thermomagnetic curve measurements as inferable from the cooling curve of Fig. 3(c). Ore microscopy showed that cubic idiomorphic to subidomorphic titanomagnetite grains are present. By emphasizing strongly magnetized parts of individual grains using a magnetic colloid, exsolution lamellae can be identified (Fig. 3a). Intergrowth structure and configuration of lamellae point to a formation of the high TC phase during high-temperature oxidation, most likely during primary cooling of the lavas. Specimens with a single high-TC are, however, rather rare in the collection. Specimens from eight lavas from Lanai and six lavas from Maui revealed such characteristics. Most other specimens showed an additional TC-range of 80–250 °C. These low TC's are interpreted as resulting from predominantly unexsolved titanomagnetite grains and, possibly, Fe-rich hemoilmenite grains (Fig. 3b), mostly already accompanied by minor maghemitization. Advanced maghemitization leading either to additional TC's (Figs 3b and c) or exclusive TC's between 300 and 420 °C is observed in almost 45 per cent of the samples from Lanai and 25 per cent of the Maui collection. By ore microscopic observation of colloid covered samples, the formation of titanomaghemite during low-temperature oxidation is observed particularly at the rim of individual grains and along cracks within grains (Figs 3b and c). A few samples showing more than one TC were subjected to continuous thermal demagnetization of the natural remanent magnetization (NRM). A reversible increase of magnetization during heating, with a respective decrease during cooling was found in some of these samples when conducting a heating/cooling cycle above the lower TC and below the higher TC. This signature is interpreted as being caused by magnetic interaction leading to partial self-reversal of magnetization (Heller & Petersen 1982; Krása 2003). We found that this does not bias the directional information of the high temperature component. With respect to palaeointensity determinations, however, partial self-reversal due to secondary minerals would bias the experiment (Coe 1974).
![Thermomagnetic curves and light microscopic pictures of specimens from Maui [(a) M-PGA1-5, (b) M-PGB1-5] and Lanai [(c) L-K26-5]. Solid lines indicate heating curves, dashed lines show cooling curves of strong-field thermomagnetic measurements. For ore microscopic observations the samples were covered with magnetic colloid to emphasize strongly magnetized parts. Titanomagnetites of various grain sizes and different oxidation states, as well as hemoilmenites are found in all lavas from Lanai and Maui. Idiomorphic and subidomorphic titanomagnetites with ilmenite lamellae are the dominant magnetic mineral in single high-TC specimens (a). Unexsolved titanomagnetites are present in most samples, accompanied by grains of differently advanced grade of alteration (b and c). Titanomagnetites/Titanomaghemites with cruciform and dendritic structures (c) are only present in tholeiites from Lanai.](https://oup.silverchair-cdn.com/oup/backfile/Content_public/Journal/gji/179/1/10.1111/j.1365-246X.2009.04264.x/3/m_179-1-43-fig003.jpeg?Expires=1716427998&Signature=xHZylfQaFjNJm3KIR0lsmR0at1e65oISLE6RURQEBMp2ZLrU3Sc8gWMQkxUehRZPBLT2tBrAvfDWbVULlDj5yIpD4wxCk0T06pz6auBJVfBstDnK5ubGLrmYCiKeHEqQpZW3fa9u7p2YxHjroiqsIpTv7gt~RckadLih0YIU0h2ZGkybAD029~Tb5dWHcmw42qSNZB6HQL00oknM101i8tLpG06N3sO0XLDi9k4AKE6zYNsIK6cxuBYm9vlDZ~hGdIptKKmNvHVXn05OZlJ16XC~vqLPNWt6l-6iNtbdkPFW0Gg5gvgHDpLyYDIwwQeStyyDmpprPkFW8XBzAtS9wQ__&Key-Pair-Id=APKAIE5G5CRDK6RD3PGA)
Thermomagnetic curves and light microscopic pictures of specimens from Maui [(a) M-PGA1-5, (b) M-PGB1-5] and Lanai [(c) L-K26-5]. Solid lines indicate heating curves, dashed lines show cooling curves of strong-field thermomagnetic measurements. For ore microscopic observations the samples were covered with magnetic colloid to emphasize strongly magnetized parts. Titanomagnetites of various grain sizes and different oxidation states, as well as hemoilmenites are found in all lavas from Lanai and Maui. Idiomorphic and subidomorphic titanomagnetites with ilmenite lamellae are the dominant magnetic mineral in single high-TC specimens (a). Unexsolved titanomagnetites are present in most samples, accompanied by grains of differently advanced grade of alteration (b and c). Titanomagnetites/Titanomaghemites with cruciform and dendritic structures (c) are only present in tholeiites from Lanai.
Ms(T) measurements already revealed magnetomineralogical changes during heating/cooling cycles (Fig. 3c). Such alterations are of particular interest for palaeointensity determinations using Thellier-type techniques, since these involve numerous laboratory heating/cooling cycles in zero magnetic field, as well as in non-zero fields. Magnetomineralogical changes during laboratory treatment affect the capacity of samples to acquire partial thermoremanent magnetizations (pTRM) and may lead to failures of the experiment. In order to quantify such alteration mechanisms and analyse their possible effects on our intensity experiments, alternating field (AF) demagnetization of an ARM (150 mT AC, 50 μT DC) in room temperature and after heating to 200, 400 and 550 °C according to Leonhardt et al. (2000) were performed on 11 samples showing different rock magnetic characteristics, as well as different alteration characteristics during absolute palaeointensity determination (Fig. 4). Non-altering samples show a linear relationship with a slope of 1 in these plots (Fig. 4a). Fig. 4(b) shows a sample with significant deviations from this line after heating to 400 °C. Magnetomineralogical changes led to a strong increase of the low coercivity magnetic fraction, whereas the high coercivity fraction decreases slightly. After heating to 550 °C the high coercivity fraction further decreased. The low coercivity fraction also decreased with respect to the 400 °C step. The increase of the low coercivity fraction at high temperature is of particular interest for palaeointensity determinations, as it can be interpreted in a way that it leads to a more multidomain (MD) like behaviour of samples at intermediate to high temperatures, which may bias the interpretation of high temperature segments.
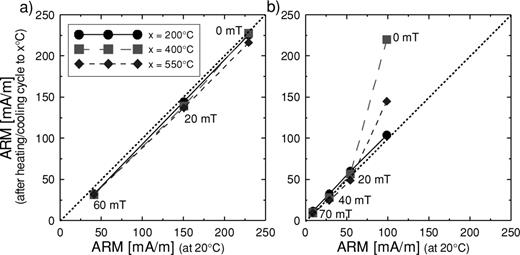
AF demagnetizations of an ARM at room temperature versus demagnetizations of ARM after heating to 200, 400 and 550 °C for single high-TC sample M-PGA5-7 (a) with similar characteristics as Fig. 3(a) and M-PGB1-4 (b) which has comparable characteristics to Fig. 3(b). Linear behaviour with slope 1.0 indicates that no alteration occurred during the experiment (a). Magnetomineralogical changes lead to a deviation from this line (b).
3.2 Palaeodirectional analysis
Measurements and demagnetization of the NRM were performed in the magnetically shielded room at the palaeomagnetic laboratory of the University of Munich in Niederlippach. Remanence measurements were carried out using a Molspin spinner magnetometer and, for weakly magnetized samples, with a 2G cryogenic magnetometer. On average, one half of the samples was treated thermally up to 600 °C and the other half with stepwise AF demagnetization up to 150 mT. For the majority of the lava flows thermal and AF demagnetization were equally effective for determining the characteristic remanent magnetization (ChRM) of the samples. The demagnetization data were analysed using principal component analysis. Typical demagnetization diagrams are shown in Fig. 5. A primary characteristic component could be unambiguously identified in 93 per cent of the samples. Viscous overprints yielding the present-day magnetic field direction were observed, but these could usually be removed at demagnetization steps below 200 °C or 20 mT, respectively. Secondary components up to 400 °C were also found in a few samples, likely related to the presence of titanomaghemites. Despite our precautions during sampling, a few samples from Maui were affected by lightning strike remagnetizations which were then identified by differences between magnetic and sun compass orientation and during laboratory treatment by high NRM intensities and AF demagnetization characteristics. These samples and a few others with unstable directions were excluded from further analysis. For nine samples a stable end point analysis was not suitable, wherefore the great circle technique according to McFadden & McElhinny (1988) was applied. The mean directions for each lava flow were calculated using Fisher (1953) statistics (Table 1).
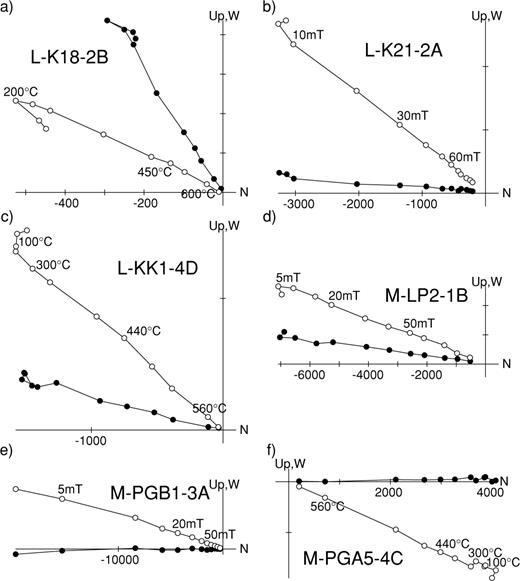
Orthogonal projections of demagnetization data from Lanai and Maui. Scales on the axis are given in mA m−1. Open symbols correspond to projections on the vertical plane, solid symbols to the projection on the horizontal plane.
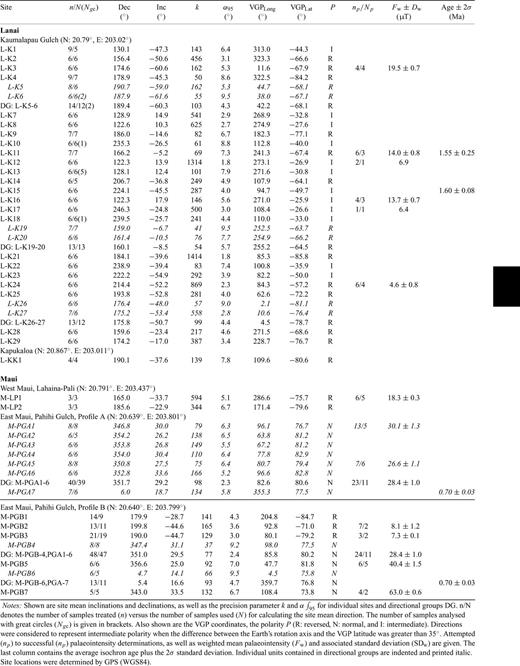
Palaeodirectional results from Lanai and Maui.
Successive lavas were tested whether they recorded independent states of the geomagnetic field. In order to quantify the independency of successive directions we used the F-distribution test (e.g. Butler 1992). The probability to which successive flows are independent was calculated and for values less than 95 per cent between flows, the lavas are assumed to have recorded the same geomagnetic field. These flows were then combined to a directional group DG (Table 1). This purely directional approach is supported by similar intensities within DG M-PGA1-6. For the other DGs this assumption is only based on directional results, for which the grouping is not completely unambiguous. Calculation started from the lowest and, therefore, oldest flow.
Intermediate directions, where the difference between the Earth's rotation axis and the virtual geomagnetic pole (VGP) latitude is greater than 35°, are observed in 12 flows from Lanai. It is found that these intermediate directions fall into two specific groups. The first group, hereinafter transitional field state 1, shows directions of inclination (I) ∼ 14°, declination (D) ∼ 125°, the other group, transitional field state 2, I≃−34°, D≃ 233°. Herrero-Bervera et al. (2000) also sampled two sites close to Kaumalapali Harbour (sites 6 and 7) which show very similar field directions to the lavas investigated here. Site 7 of Herrero-Bervera et al. (2000) also recorded an intermediate direction corresponding to transitional field state 2.
Two polarities are identified in profile M-PGB in the Pahihi Gulch of Maui. The lower three flows record reverse directions, the upper four flows normal directions of the geomagnetic field. According to the radiometric ages of the Kula series, this field reversal corresponds to the Matuyama/Brunhes transition. Previously, records of this transition with several intermediate directions were found in the Kula volcanics within the caldera of the Haleakala volcano (Baksi et al. 1992; Coe et al. 2004b). In the sampled profiles presented here, however, no transitional directions are found. This is very likely linked to the significant distance to the eruption centre and the relatively sporadic eruption frequency of post-shield volcanics.
3.3 Palaeointensity determination
Thellier-type palaeointensity determinations were only conducted on samples, which yield the mean characteristic remanence direction of the flow. Furthermore, we selected samples, which appear to be most suitable according to rock magnetic and palaeomagnetic measurements, in particular, samples showing evidence for predominant high temperature oxidation during primary cooling of the lavas, minimal alteration during thermal treatment, low viscosity and high magnetic stability. Samples showing partial self-reversal or mixtures of different magnetic minerals were discarded. Palaeointensity determination of samples showing an increase of low coercivity during the thermal ARM experiments (Fig. 4b) were also not analysed, neither corrected nor uncorrected for alteration. Altogether 107 samples from 26 lavas were chosen for palaeointensity determinations. Successful results were obtained from 43 samples of 13 lavas. 90 per cent of the measurements were performed in an argon atmosphere on minicores with a diameter of 5 mm. The other samples were of standard inch-size and were treated in air, yielding a similar success rate and similar results as the minicores. All palaeointensity determinations were conducted in a MMTD20 thermal demagnetizer, with a laboratory-built sample holder for minicores. These minicores were taken unoriented from the lower part of individual drill cores and the primary character of the direction was ascertained by the demagnetization of sister specimens from the same drill core. Due to the smallness of the specimens the orientation in the sample holder along the x- and y-axis within the cryogenic magnetometer the results were affected with slightly higher deviations, leading to a more scattered declination information than for inch specimens. Pilot samples (e.g. Fig. 6d) were not oriented within the x–y plane, since the previously used sample holder for the cryogenic magnetometer did not allow an accurate x–y orientation. Therefore, the declination varies strongly for them. The acquisition of pTRM along the sample's z-axis, however, was accurate within 1°, wherefore vector subtraction for the analysis of minicore determinations can be performed exclusively along the z-axis. The major advantage of using minicores stems from a reduced time for each heating cycle and the use of a larger collection of samples within one measurement run which are all centred in the furnace, guaranteeing a small temperature gradient. Laboratory fields of 20–35 μT, applied during heating and cooling, were used for all measurements. Field accuracy is 0.1 μT. All palaeointensity determinations were analysed using the ThellierTool software (Leonhardt et al. 2004a) by applying the default criteria of this software.
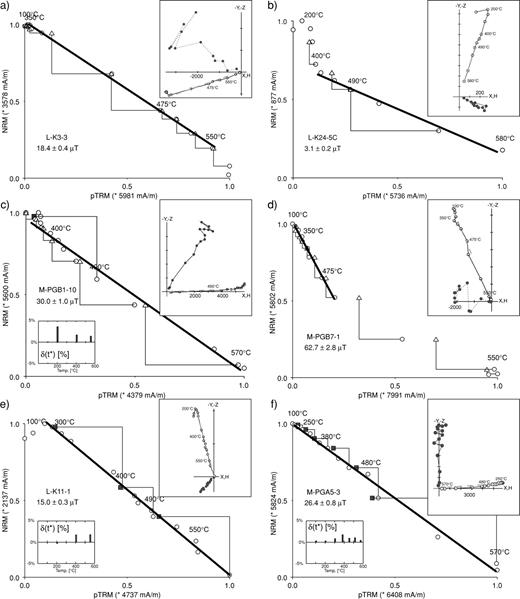
NRM/pTRM diagrams for six samples from Maui and Lanai. The straight line segment is well defined and covers on average 69 per cent of the NRM for the collection. Triangles indicate pTRM checks and squares denote additivity checks. In case of MT4 experiments a inset on the lower left of the plots shows the directional corrected measure of the tail, normalized to the true NRM (Leonhardt et al. 2004b). The directional demagnetization behaviour is shown in the orthogonal projection in the upper right of each plot. Relatively large directional deviations, not related to field components, are present in pilot minicore samples (a and d). Figs (e) and (f) represent two NRM/pTRM diagrams after applying corrections for magnetomineralogical changes (Valet et al. 1996; Leonhardt et al. 2003). The additivity checks fit the corrected pTRM values, indicating that MD remanence does not bias the determination and alteration correction was successful.
Pilot samples were measured using two modifications of the Thellier method, MT1 and MT2 (see (Leonhardt et al. 2004a) for a detailed description of these modifications). MT1 refers to experiments with demagnetization at a given temperature prior to acquisition of a pTRM at the same temperature. The inverse treatment, in-field measurement before zero-field measurement is termed MT2. MT2 experiments enable one to identify components of magnetization acquired during the field-on step which are not removed by thermal demagnetization to the same temperature, either due to alteration or MD-tails. Most palaeointensity determinations were performed with the modified Thellier-technique MT4, which is a zero-field first method, and besides, the commonly used pTRM check additionally incorporates additivity checks (Krása et al. 2003) and pTRM-tail checks (Riisager & Riisager 2001) evaluated with respect to the directional difference between applied field and NRM according to Leonhardt et al. (2004b). pTRM checks were conducted for all methods ‘in-field’ after the demagnetization step. The results and statistical parameters for successful determinations are listed in Table 2. The calculation of a weighted standard deviation (SDw) is strictly speaking mathematically not correct since the weight is not determined according to the theory of errors. Nevertheless, the quality differences of palaeointensity determinations and, therefore, the applied quality related weighting of palaeointensity encourage us to weight the standard deviation as well. Most specimens are from separately oriented drill cores. For some sites, several specimens were measured from the same drill core, for example, M-PGA5-2 and M-PGA5-2D (Table 2) where specimen 2 is a minicore taken, as always, from the lowermost part of the drill core and specimen 2-D is an inch sample from the same core. For calculation of the mean palaeointensity of these sites, the multiple measurements of one drill core were averaged before calculating an overall site mean from independent drill core results. Some examples of accepted palaeointensity determinations are shown in Fig. 6. Twenty-two samples of the collection were analysed using corrections for magnetomineralogical changes (Valet et al. 1996; Leonhardt et al. 2003). This method uses the cumulative difference of pTRM checks for correcting alteration which affects blocking/unblocking temperatures below the heating step of the check. An important prerequisite for applying this method is a proven absence of MD remanence. In addition to curved diagrams, MD effects also led to biased pTRM checks (Leonhardt et al. 2004b), whose differences to the pTRM value are used for correcting magnetomineralogical changes. In case of our experiments, the absence of MD remanence was tested by pTRM-tail checks and additivity checks. If correction is successful, additivity checks should fall on the associated pTRM values, and therefore provide a meaningful test regarding the quality of the correction, as they also indicate any ongoing alteration between successive heating/cooling cycles between pTRM check and additivity check as well as whether the alteration products obey Thelliers' law of additivity. If check correction was applied, the class in Table 2 was extended by a superscripted star. Check corrected and non-corrected determinations yield similar results for the lavas.
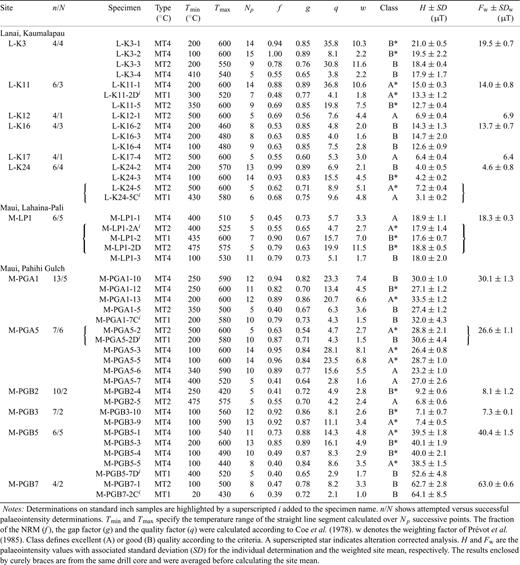
Palaeointensity results from Hawaii.
4 40Ar/39Ar Age Determination
The 40Ar/39Ar analyses were performed at Stanford University with analytical procedures identical to those published in Hacker et al. (1996). Irradiation took place at the Oregon State University TRIGA reactor. We used Taylor Creek sanidine (USGS standard 85G003; Duffield & Dalrymple 1990) with an assigned age of 27.92 ± 0.17 Ma as a neutron fluence monitor. The grains were heated under UHV conditions in a double-vacuum Staudacher-type resistance furnace. The evolved gas was purified during extraction by SAES ST-172 and ST-101 getters and a stainless steel cold finger and was analysed on a MAP 216 mass spectrometer fitted with a Baur-Signer ion source and a Johnston MM1 multiplier. Analyses were corrected for system blanks and instrumental mass discrimination using the program EyeSoreCon written by B.R. Hacker. Uncertainties for ages quoted in this paper are 2σ standard deviation.
The isochron ages are preferred over the weighted mean plateau ages. They comprise estimates of analytical precision and internal disturbance of the sample without making an assumption about the trapped argon content. Results are summarized in Fig. 7 and Table 3.
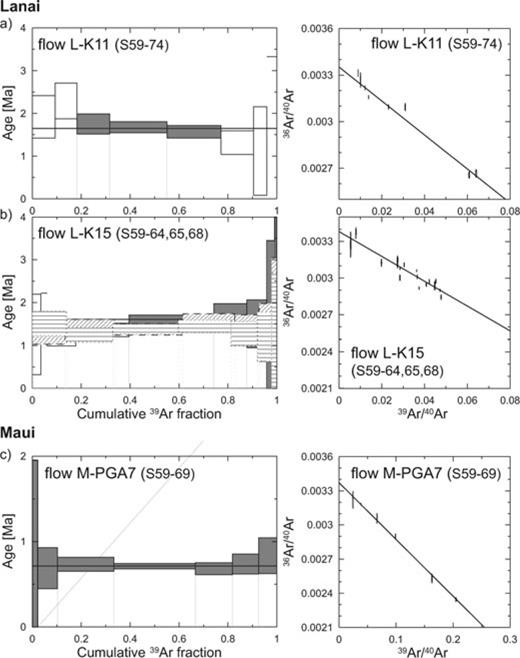
40Ar/39Ar age spectra and isochron diagrams for three dated lava flows. Multiple subsamples from a flow are shown within a single diagram.
40Ar/39Ar data.
Altogether, results from three lava flows were obtained, two lavas from Lanai and one flow from Maui. The age for the two flows from Lanai are well defined and give an average age of ≈1.6 Ma for the Lanai sequence. This age is significantly older than previous results from Bonhommet et al. (1977), which were obtained from six different sites, three of them at our sampling sites close to Kaumalapau harbour and reveal an average isochron K/Ar age of 1.20 ± 0.04 Ma for the Lanai lavas. These K/Ar ages were recalculated using modern decay standards (Steiger & Jäger 1977). The relatively young ages previously obtained for Lanai led to an anomaly within the age progression of the Hawaiian hotspot (Clague & Dalrymple 1987). The here obtained age of ≈1.6 Ma, however, is in agreement with the distance to the present-day hotspot.
5 Discussion
5.1 Lanai
The directional record of the lavas sampled at Kaumalapau, Lanai, is characterized by the recurrence of two similar intermediate directions. A detailed map with the sampling locations of all sites is shown in Fig. 8. Boxes within this map enclose sampling sites where lavas are identified as successive, however, not superimposed flows. The directional evolution, associated palaeointensities and 40Ar/39Ar ages for each of these four successions is also shown in Fig. 8. The striking recurrence of very similar field variations between those sections is interpreted as an indication for repeated sampling of the same geomagnetic event. This interpretation is principally supported by the radiometric ages of sites L-K15 and L-K11 (Fig. 8). We have, however, to admit that due to the overlapping uncertainties of these ages, this age progression is not statistically significant. Geological field evidence for the palaeomagnetic interpretation is poor. The relationship between sampling position relative to the caldera and the average dip of lavas towards the sea (8° in the lower part, 4° in the upper) further indicates that all sites are located at a similar stratigraphic level. Nevertheless, we cannot explicitly exclude that the transitional states are adopted successively several times. For further discussion we prefer to establish five directional units, consisting of pre-transitional lavas (Unit 1: L-K3,4,5,6), transitional state 1 (Unit 2: L-K7,8,12,13,16), in-between transitional state 1 and state 2 (Unit 3: L-K9), transitional state 2 (Unit 4: L-K10,14,15,17,18,22) and Unit 5 (L-K11,19,20,28) covering lavas exposed after transitional state 2. The VGPs for groups and individual lavas are shown in Fig. 9. The direction of transitional field state 1 results in a VGP position west of South America and transitional field state 2 gives a VGP position west of Australia. The path between unit 4 and 5 is defined by lavas L-K23 to L-K27. The intermediate VGP positions near Australia are very close to the location of the preferred VGP cluster of geomagnetic reversals proposed by Hoffman (1992, 1996) and within preferred longitudinal transitional VGP bands (Laj et al. 1991). The South America cluster as proposed by Hoffman (1992), however, is further east than transitional field state 1.
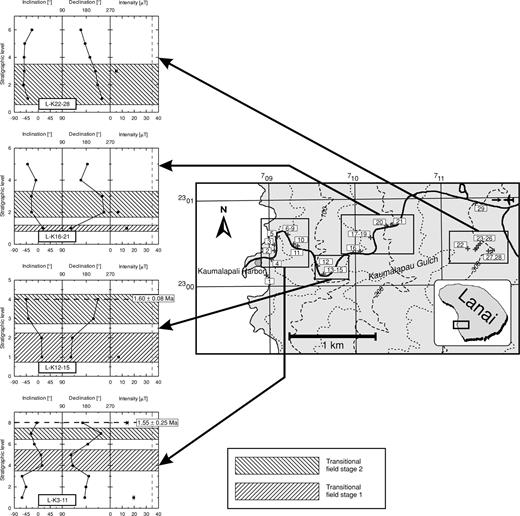
Detailed map of sampling location at Kamalapau, Lanai, and palaeomagnetic results from four sections with successively exposed lavas. Transitional field states are emphasized by hatched areas. The dashed line in the palaeointensity diagram indicates the present-day field on Lanai (∼35 μT). Transitional field states 1 and 2 occur in the lowermost three sections.
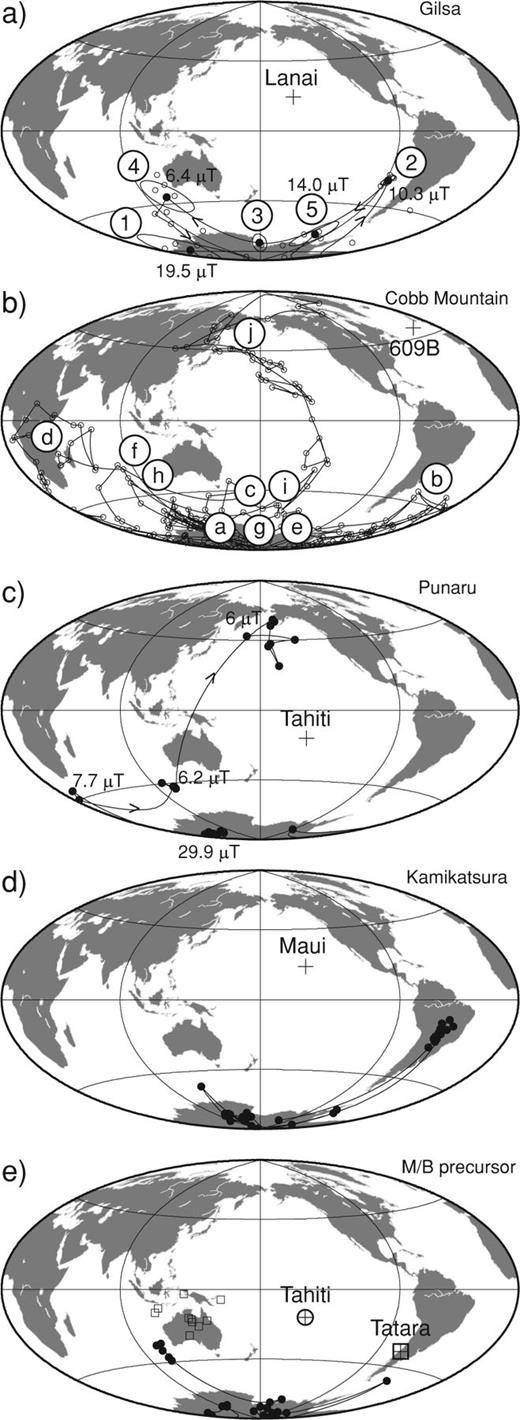
Virtual geomagnetic poles (VGPs) for individual lavas (circles) and the five directional units (solid circles with 95 per cent-error ellipse) for Lanai (a). Also shown are the average palaeointensity values for the directional units. VGPs of the most detailed sedimentary Cobb Mountain record from DSDP site 609B (Clement 1992) are plotted in (b). Encircled letters emphasize the progression of VGPs in this record. In (c) the VGPs and average palaeointensities from the Punaru section on Tahiti (Chauvin et al. 1990) are shown. (d) depicts results from the Kamikatsura record obtained on Maui, Hawaii (Coe et al. 2004a). The directional results of the Matuyama/Brunhes precursor recorded on Tahiti (Chauvin et al. 1990) and the Tatara volcanic complex in Chile (Brown et al. 1994; Brown et al. 2004) are shown as solid circles and boxes, respectively, in (e). For the sake of clarity only the onset of the recorded reverse to normal (R-N) transition from the Punaru event, Tahiti and the Cobb Mountain record of 609B is shown.
The strong variations of directions appear to happen ‘fast’, within only a few lava flows. Between each of the sites L-K6 to L-K9, there are less than four unsampled flows, and the directions change from reversed (L-K6) to transitional state 1 (L-K7 and 8), and then back to a reversed direction (L-K9). Between flows L-K13 and L-K15 the direction changes from transitional state 1 to state 2 within seven flows, equivalent to 5 m of the profile. No palaeosoil layers or erosional disconformities are found within either parts of the profile, which suggests high extrusion rates of the lavas.
Stable normal directions are absent in the sampled Lanai lavas and all transitional VGPs during the Gilsá excursion are restricted to the southern hemisphere. Nevertheless, our Gilsá record could be incomplete due to the sporadic character of volcanic activity and the gaps between sampled units. ‘Normal’ directions during the Gilsá were particularly found in northern hemisphere records, DSDP site 609B (Clement & Kent 1987), ODP site 983 and 984 (Channel et al. 2002), and the type location in Jökuldalur, Iceland (Watkins et al. 1975; Udagawa et al. 1999). Clement & Kent (1987) also favour the interpretation of a geomagnetic field excursion because the normal directions do not stabilize in the 609B record. The very short duration, <8 kyr (Clement & Kent 1987; Channel et al. 2002) is one likely reason that a significant directional indication for the Gilsá is not found in most sedimentary records. Another possibility could be that this event is more pronounced at high latitudes than at low latitudes. An intensity minimum at approximately 1.62 Ma, however, is globally observed (Valet et al. 2005).
The onset of the Gilsá excursion as recorded in the North Atlantic site 609B also shows an accumulation of VGPs southwest of Australia, similar to transitional field stage 2 from our Hawaiian record. This similarity, admittedly only based on two, at least significantly distant records, might suggest a dominance of dipolar components of the geomagnetic field during the onset of the excursion. When comparing our results of the Gilsá excursion to other records of geomagnetic events during the Matuyama, surprisingly similar VGP movements in the beginning of these geomagnetic events are observed (Fig. 9). The onset of the Cobb Mountain polarity subchron, also recorded in site 609B from the North Atlantic (Clement 1992), shows an initial VGP movement towards South America followed by several flips towards south western Australia (Fig. 9b). Similar transitional field states at the beginning of this event, in particular transitional VGPs close to Australia, are found in most palaeomagnetic Cobb Mountain records from the Atlantic and Pacific hemispheres and were also interpreted to give evidence for a dipolar dominance (Clement 2000). The onset of the Punaru cryptochron, which happened approximately 70 kyr prior to the Cobb Mountain subchron (Singer et al. 1999) and was recorded in a volcanic sequence on Tahiti (Chauvin et al. 1990), includes south west Australian VGPs associated by low field intensities (Fig. 9c). The 0.9-Myr-old Kamikatsura excursion recorded in Maui (Coe et al. 2004a) is characterized by transitional VGPs in South America and Australia (Fig. 9d). An approximately 0.795-Myr-old precursor to the Matuyama/Brunhes transition was recorded in volcanic rocks from Tahiti and Chile (Chauvin et al. 1990; Brown et al. 1994, 2004; Singer et al. 2005). This precursor exhibits transitional VGPs close to Australia (Fig. 9e). In summary, the recurrence of similar VGP position in spatially distributed records of individual excursions indicates a dominantly dipolar geomagnetic field at the onset of these events, the recurrence of similar transitional VGP positions within the suggested preferred longitudinal bands (Laj et al. 1991) and close to the suggested VGP cluster regions (Hoffman 1992) in different excursions supports the hypothesis of an influence of lower mantle heterogeneities on the transitional field at least during the onset of these geomagnetic events. It should be mentioned, however, that later transitional directions, related to R-N transitions, do not show this agreement with the preferred VGP positions. In case of Figs 9(b) and (c) they tend to plot on central Pacific longitudes.
5.2 Maui
The isotopic age range of the volcanic Kula series from Maui (0.9–0.4 Ma, Naughton et al. 1980) indicates that the Matuyama/Brunhes transition is recorded within this series. A Brunhes age for the normally magnetized lavas is supported by the 40Ar/39Ar age of 0.70 Ma for flow M-PGA7. The stratigraphically lower and therefore older reversely magnetized flows were most likely formed during the Matuyama chron. A detailed record of the the Matuyama/Brunhes reverse to normal (R-N) transition, with several transitional directions was previously also found in the post-shield Kula volcanics within the caldera of the Haleakala volcano at two different locations (Baksi et al. 1992; Coe et al. 2004b) and was dated by the 40Ar/39Ar method in both studies. The large distance between the Pahihi Gulch and the eruption centre may account for the observation that no transitional directions are present in our record.
The major aspect of the sampled Pahihi Gulch succession is the recording of the pre- and post-transitional behaviour of the geomagnetic field. Our results indicate low intensities prior to and an increasing strength of the geomagnetic field after the reversal. The obtained post-transitional palaeointensities after the reversal reach high intensity values, up to about twice of the present-day's intensity of the Earth's magnetic field at Maui (∼35 μT, Fig. 10). An almost identical observation of such intensity asymmetry across the last reversal was found in a sedimentary record close to Hawaii (Theyer et al. 1985). A comparison of our absolute intensities with those relative values of sedimentary record K78-10-30 emphasizes the similarity (Fig. 10). Other globally distributed records from the Matuyama/Brunhes reversal, in particular the absolute palaeointensity results from two profiles from La Palma, Canary Islands (Valet et al. 1999) also indicate weaker pre- and higher post-transitional field strength, although the asymmetry is not equally strongly pronounced as in Hawaii. Yet, such feature does not only appear to be restricted to the last reversal. Herrero-Bervera & Valet (2005) found similar behaviour in the volcanic reversal records from Waianae, Oahu. The volcanic record of a late Pliocene R-N transition from Kauai, Hawaii also shows strong post-transitional fields compared to the pre-transitional state (Bogue 2001) and several other detailed volcanic R-N transition records exhibit similar characteristics (e.g. Prévot et al. 1985; Leonhardt & Soffel 2002). A geomagnetic field asymmetry across reversals appears to be at least a characteristic of R-N transitional records. The unusually strong field intensities after the reversal can be interpreted in terms of a surface geomagnetic field where the dipolar contribution is more dominant in the post-transitional field state than in the pre-transitional state. Such interpretation is supported by a geomagnetic field model of the last transition, where non-dipolar contributions are significantly stronger prior to the reversal than afterwards (Leonhardt & Fabian 2007). A possible explanation for the underlying process of a field intensity asymmetry is suggested by comparisons to numerical geodynamo models. Such dynamo models point to two different dynamic regimes within the Earth's fluid outer core, within and outside the tangent cylinder (Glatzmaier et al. 1999). The tangent cylinder is an imaginary cylinder, tangent to the equator of the Earth's solid inner core. Simulated reversals of Glatzmaier et al. (1999) show that during most reversals poloidal and toroidal fields change their polarity first outside the tangent cylinder and then, a few thousand years later, within the cylinder. If the fields outside the tangent cylinder are getting more turbulent a significant time before the actual reversal, the surface geomagnetic field would still be dipolar dominated due to the reduced influence of short wavelength components of the field on the Earth's surface. The surface field intensity, however, would be relatively low. After the fields reversed within and outside the tangent cylinder, again a dominantly dipolar field is maintained. After the field reversed in both dynamic regimes, a fairly regular configuration of outer core magnetic fields could lead to a more strongly dipolar dominated state than prior to the transition and, therefore, to comparably higher post-transitional palaeointensities in most locations on Earth.
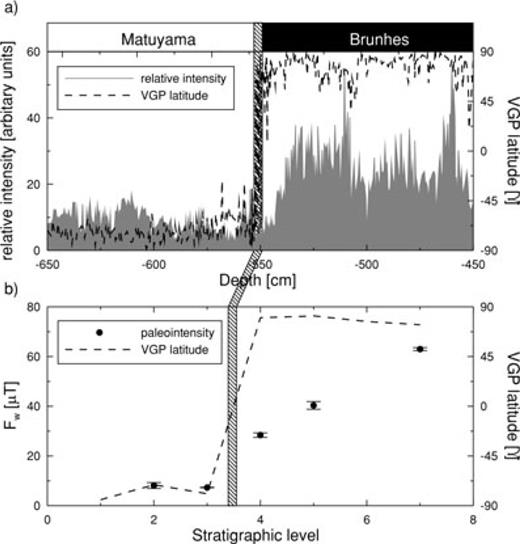
Intensity variation across the last reversal. The relative palaeointensity variation and VGP latitude obtained in piston core K78-10-30 close to Hawaii (Theyer et al. 1985) are shown in (a). The results from our profiles (b) show a similar asymmetry of palaeointensities across the reversal.
6 Conclusion
Lava flows sampled in a palaeomagnetic reconnaissance study on Lanai, Hawaiian islands, recorded reverse and intermediate directions of the geomagnetic field. 40Ar/39Ar age determinations show, that these lavas were formed approximately 1.6 Ma. This finding indicates, unlike previous age determinations on this island, that the early evolution of Lanai is in agreement with the average age progression of the Hawaiian hotspot. All intermediate palaeomagnetic directions fall in two specific groups, corresponding to VGPs west of South America and southwest of Australia. The observation of intermediate directions suggest that the lava record represents the Gilsá geomagnetic polarity excursion 1.6 Ma. Other globally distributed records of the Gilsá excursion show similar VGP directions during their onset, indicating a dipolar dominance during this time. Furthermore, similar transitional field states, in particular transitional VGPs close to Australia are found in most palaeomagnetic records from geomagnetic excursions during the Matuyama chron. The locations of the transitional field stages correspond to suggested preferred position of VGPs, which were related to zones of low seismic velocities in the lower mantle (Laj et al. 1991; Hoffman 1992). Therefore, our results support the hypothesis of an influence of lower mantle heterogeneities on the geomagnetic field at least during the onset of the polarity events. Absolute palaeointensity determinations using modifications of the Thellier technique point to generally low field intensities on Hawaii during this time, which decrease to values of 4.6 μT during transitional states. Palaeointensities, however, could be obtained only from 6 of 30 sampled lavas on Lanai. The presence of post-genetic titanomaghemites in these rocks, as well as significant alteration during thermal laboratory treatment affecting the coercivity spectrum and, therefore, very likely the average domain state of the samples lead to this very low success rate. The palaeointensity determination success rate is somewhat higher for the less altered lavas sampled on Maui, which contain a record of the last geomagnetic reversal, the Matuyama/Brunhes reversal. Palaeointensity increases from very low pre-transitional field strengths of 8–63 μT, about twice the present-day field after the reversal. Transitional directions were not found in the sampled sequence. A similar strong difference of pre- and post-transitional fields is also found in a sedimentary piston core record close to Hawaii, supporting our conclusion that the geomagnetic field asymmetry during the Matuyama/Brunhes reversal was particularly pronounced close to Hawaii.
Acknowledgments
We would like to thank the Haleakala Ranch for sampling permission. Emilio Herrero-Bervera and Rob Coe are acknowledged for their support during preparation of the field work. Brad Clement kindly provided the data set of site 609B. Constructive reviews by Carlo Laj, Jean-Pierre Valet and Emilio Herrero-Bervera significantly improved the manuscript. We profited from many discussions with David Krása and Christoph Heunemann. Sampling was funded by the German Science Foundation (He1814/9-1).
References
