


Summary
Tomographic inversion of local earthquake P- and S-wave traveltime data is used to investigate 3-D P-wave velocity (Vp) and P-wave/S-wave velocity ratio (Vp/Vs) variations at the Tongariro Volcanic Centre (TgVC), New Zealand. P-wave model resolution is generally high throughout the TgVC at depths of around 3–9 km below sea level. Near-surface resolution is lower since rays at shallow depths are predominantly subparallel. Resolution decreases below 12 km depth due to clustering of seismicity at greater depths. The final 3-D Vp model shows low-velocity volumes from 3 to 7 and 8 km depth, respectively beneath the active volcanoes Ruapehu and Ngauruhoe. Smaller low-velocity volumes are observed beneath the active Tongariro volcano and the extinct Tama Lakes vents. Synthetic tests indicate that the resolution of the 3-D Vp/Vs model is insufficient to permit any reliable interpretation.
Accurate earthquake depths are determined for the first time within the TgVC. Seismicity is largely restricted to two clusters west of Ruapehu, possibly with origins on eastward striking branches of the normal Raurimu Fault, two lineations near Waiouru in the south-east of the study area and a fault belt between Tongariro and Lake Taupo in the north of the study area.
Earthquake depths indicate possible shallowing of the brittle-ductile transition beneath Ruapehu and Ngauruhoe.
1 Introduction
The Tongariro Volcanic Centre (TgVC) lies at the southern terminus of the Taupo Volcanic Zone (TVZ), a region of backarc rifting and intense volcanism formed in response to westward subduction of the Pacific plate beneath the North Island, New Zealand (Fig. 1). The TVZ exhibits predominantly andesitic volcanism in the north and south and extremely productive rhyolitic volcanism in the centre (e.g. Wilson et al. 1995).
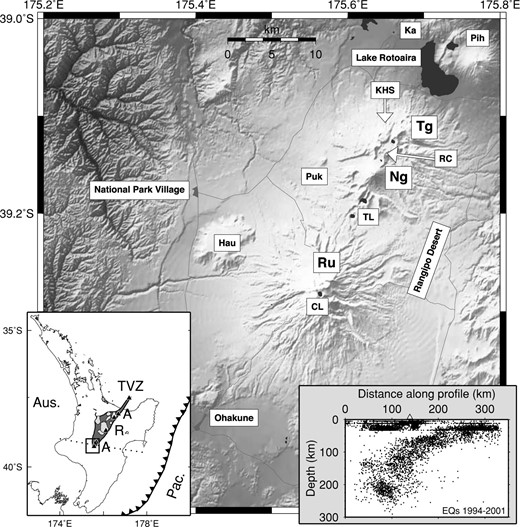
Main panel: Geographical map of the Tongariro Volcanic Centre. Tg—Tongariro; Ng—Ngauruhoe; Ru—Ruapehu; Hau—Hauhungatahi; Ka—Kakaramea; Pih—Pihanga; Puk—Pukeonake; KHS—Ketetahi Hot Springs; RC—Red Crater; TL—Tama Lakes; CL—Crater Lake. Lower left panel: tectonic setting of the TgVC. TVZ—Taupo Volcanic Zone; A—Andesitic sections of TVZ (black triangles denote large andesitic cones); R—Rhyolitic section of TVZ (light grey areas denote rhyolitic systems); Aus—Australian plate; Pac—Pacific plate. Small black rectangle shows area of main panel. Dotted line shows location of cross-section shown in lower right panel. Lower right panel: seismicity located within a 50-km-wide swathe by New Zealand National Seismograph Network, 1994–2001. White triangle marks location of TgVC. Note the large number of restricted depth locations indicating poor hypocentral constraint.
The TgVC consists of several large, predominantly andesitic volcanoes (Fig. 1): Ruapehu, Ngauruhoe and Tongariro are currently active, while Hauhungatahi, Pukeonake, Pihanga and Kakaramea are extinct. Other volcanic vents include the large flooded vents of Tama Lakes and several small craters near Ohakune. In this paper we will use the term TgVC to refer to the currently active portion of the area, namely the Ruapehu, Ngauruhoe and Tongariro massifs and surrounding ring plains including Hauhungatahi.
Much previous work on the TgVC has focussed on the geochemical/petrological and seismological properties of the system. While a great deal of knowledge has been gained concerning the eruptive history of the TgVC volcanoes, seismological surveys have necessarily been limited in scope due to a lack of instrumentation. As a consequence the crustal structure of the area is not known in any detail. This paper aims to address this situation by presenting 3-D Vp and Vp/Vs seismic tomographic models of the uppermost 12 km of the crust beneath the TgVC, together with accurate local earthquake locations.
1.1 Previous geochemical/petrological studies of the TgVC
The Tongariro massif was generated during several periods of intense eruptive activity, beginning at least as far back as 275 ka with further bursts of growth at 210–200 ka, 130–70 ka and from 25 ka to the present (Hobden et al. 1996). The most recent of these eruptive episodes has given rise to the relatively complex system of cones seen today, with activity over the last 2500 yr confined principally to Ngauruhoe.
Since modern records began (around 1830 AD) there has been an eruption of Ngauruhoe once every two or three years on average. These eruptions have varied widely in style over short timescales, as shown by the diverse chemical and isotopic compositions of the erupted products (Hobden et al. 1999, 2002). No simple time-composition relationship has been found for successive eruptions and it is therefore unlikely that large, crustal magma reservoirs feed the Ngauruhoe system. Small (<0.1 km3), short-lived batches of magma are more likely to be responsible for the variability of the observed eruptions. Such small volumes are extremely difficult to resolve using seismic tomography, particularly if they contain low-velocity material.
Gamble et al. (1999) analysed the material erupted at Ruapehu during the last 50 yr. Geochemical variations within this 50-yr time window were found to cover most of the range shown by lavas erupted from the volcano over its entire history. This short timescale variability in magma chemistry was explained by influxes of fresh magma into pre-existing pods of melt left over from previous eruptions. The most recent eruptions of 1995–1996 were interpreted as being due to one of these magma recharging events, an interpretation shared by Nakagawa et al. (1999). Based on historical records, recent re-injections of magma are thought to occur every 20–30 yr. Gamble et al. (1999), therefore, concluded that Ruapehu is fed by an open magma system which is, at least to first order, continually active.
Further notable volcanic activity in the TgVC has occurred from the Hauhungatahi and Tama Lakes vents. However, the most recent activity at Hauhungatahi dates from >340 ka (Hackett 1985), while Tama Lakes are not thought to have erupted since the large 10 ka Pahoka—Mangamate sequence of eruptions (Nairn et al. 1998).
1.2 Previous geophysical studies of the TgVC
Previous seismological studies of the TgVC have primarily focussed on Ruapehu and to a lesser extent Ngauruhoe. Following the upgrade of the permanent network in the TgVC in 1976 three vertical component stations operated at Ruapehu and Ngauruhoe. Latter (1981b) analysed seismicity from this early TgVC network and proposed a new system of earthquake classification for Ruapehu and Ngauruhoe. High-frequency events (>3 Hz) with sharp onsets and clear phases were termed ‘tectonic’ Within 9.5 km of Ruapehu and 8 km of Ngauruhoe such events were further described as ‘volcano-tectonic’ Low-frequency events (<2 Hz) were termed ‘volcanic’ and were thought to be produced by a prolonged or repetitive source mechanism within heat weakened material. These events were confined to smaller and shallower volumes beneath both volcanoes.
Latter (1981a) used earthquake data from the early TgVC network and from two temporary seismometers to map highly attenuative bodies within the upper crust near Ruapehu and Ngauruhoe. These bodies were interpreted as zones of partially molten rock. Five such zones were identified in the immediate vicinity of the two volcanoes. However, the uncertainties in the earthquake locations used (derived from a maximum of only five stations) mean that the exact locations and geometries of these attenuative bodies should be treated with some caution.
An early investigation of the velocity structure of the southeastern ring plain of Ruapehu was made by Sissons & Dibble (1981). A 22-km NNE-striking profile was surveyed using several shots and a combination of seismometers and geophone spreads. The loose tephra of the near surface exhibited a very low Vp of less than 0.5 km s−1. This was underlain by more consolidated tephra with Vp of 1.1–1.5 km s−1 and thicknesses of around 10–40 m. The next layer down was around 600 m thick with Vp of 2 km s−1, interpreted as lahar deposits emanating from Ruapehu Crater Lake. Beneath the lahar deposits a layer of greywacke was detected with Vp of 4.9 km s−1 and a thickness of some 1.1 km. This layer was in turn underlain by more consolidated greywacke with Vp around 5.4 km s−1. In the southern section of the profile a 3 km s−1 refractor was also found, and was thought to represent Tertiary marine sediments underlying the volcanic sediments. This feature was however, less well-constrained.
More recently changes to the seismicity of Ruapehu following the 1995–1996 eruptions were noted by Sherburn et al. (1999) and Bryan & Sherburn (2003). Prior to the eruptions volcanic tremor and earthquakes were dominated by a 2 Hz spectral peak and some higher frequencies. After the eruptions, although these frequencies were still present, the dominant frequencies were from 0.8 to 1.4 Hz. This change in frequency content was interpreted as being due to a change in the magmatic plumbing system of the volcano. Further evidence for changes to the magmatic system beneath Ruapehu were provided by the results of Miller & Savage (2001) and Gerst & Savage (2002). They observed a change in the fast direction of polarized shear waves beneath Ruapehu before and after the eruptions of 1995–1996. These observations were attributed to a change in the local stress regime caused by a pressurized tabular magma body being intruded beneath the volcano prior to the eruption, and a subsequent depressurization and re-adjustment of the stress field following the eruption.
Broader studies of the TgVC have also been conducted. Haines (1979) analysed travel times of Pn and Sn phases recorded at a permanent station within the TgVC. He obtained extremely low values of Vp= 7.4 km s−1 and Vs= 3.95 km s−1 in the uppermost mantle beneath the TVZ, attributing them to the presence of partial melt.
Olson (1985) used a traveltime graph obtained from recordings of two shots fired in Ruapehu Crater Lake (Dibble et al. 1985) to construct a 1-D P-wave velocity model beneath Ruapehu. This model was then used to locate earthquakes recorded in the surrounding area over a 2 week period. Olson found several earthquakes at shallow depths beneath Ruapehu Crater Lake, preceding bursts of emergent, low-frequency volcanic events. Most of the remaining seismicity was located in the Waiouru area and around 35 km WSW of Ruapehu. Several events were also detected around National Park village and around the southern flank of Ruapehu. All local seismicity, except that below Crater Lake, occurred between 9 and 31 km depth with deeper slab events located between 67 and 100 km depth. However, the short recording period and the low level of seismic activity precluded the determination of a comprehensive picture of seismicity within the TgVC.
A 2-month deployment of 14 broad-band seismometers in 1994 in conjunction with the short-period permanent network stations permitted reasonable earthquake locations to be obtained throughout the TgVC (Hurst & McGinty 1995). A southwards transition was found from the exclusively shallow (<10 km deep) seismicity of the TVZ (e.g. Bryan et al. 1999), which persisted as far south as Lake Rotoaira, to deeper seismicity extending down to 20 km depth near Waiouru. This temporary deployment also enabled further investigation into the shallow events detected by previous research in the vicinity of Crater Lake. Volcano-tectonic events were located beneath Crater Lake and also in nearby areas to the south and northwest, while low-frequency volcanic events were confined to an area below the east side of Crater Lake (Hurst & McGinty 1995; Hurst 1998). Although the depth of the low-frequency volcanic events could not be determined accurately, they were thought to occur within a 200 m thick zone somewhere between 100 and 1600 m below Crater Lake.
A series of earthquakes occurred some 15–20 km to the west of Ruapehu a few months before the 1995 eruption (Hurst & McGinty 1999). The two strongest swarms took place shortly before rapid increases in the temperature of Crater Lake. Together with chemical changes in the lake these rapid heating phases were taken as evidence of interaction between fresh magma and lake water. However, the precise relationship between the occurrence of the swarms and the inferred upward movement of magma beneath Ruapehu remained unclear. Relocation of the earthquakes using a 1-D velocity model showed three clusters of seismicity with epicentres close to the normal Raurimu fault. However, composite focal mechanisms for these clusters were not consistent with simple normal motion on this fault. One of the clusters (cluster A) had an oblique-reverse mechanism (predominantly reverse) with one nodal plane almost parallel to the Eastern Raurimu Fault. The mechanisms of the two remaining clusters were oblique-normal, again with strong normal components.
Sherburn (1993) provides a good summary of non-seismic geophysical observations made in the area. Three main surveys have been conducted. Firstly, sparse gravity measurements are available. The most noticeable features are regional lows associated with the TVZ and the Wanganui basin. Sherburn calculated to first order that a negative anomaly associated with Ruapehu was due to low density material within the cone itself, rather than beneath the base of the volcano. Further interpretation, however, would require a higher resolution data set. Secondly, data from two aeromagnetic surveys found several positive anomalies over Tongariro, Ngauruhoe and Pihanga and a negative anomaly over Ruapehu. These were found to be consistent with highly magnetized plugs beneath the three northern cones and a reversely magnetized, or possibly a hot unmagnetized plug, beneath Ruapehu. Finally, a resistivity survey over Tongariro delineated two conductive zones. The first zone was attributed to a region of acid condensate, and was thought to feed both Red Crater and Ketetahi Hot Springs. The second, deeper zone was interpreted as a layer of hot brine.
2 Data and Analysis
2.1 Data
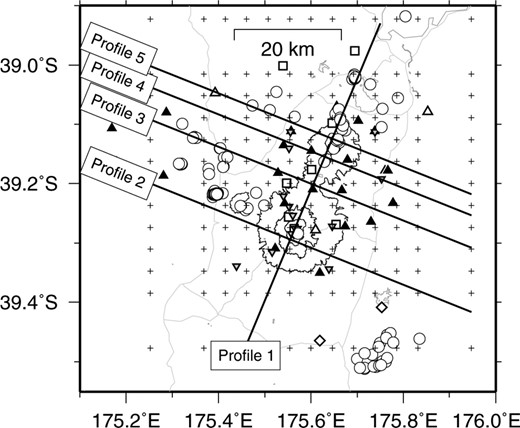
The data set used in this study is composed of local earthquake arrival times recorded by an array of 20 Güralp CMG-40TD and 3 CMG-3TD seismometers during the period 2001 January to June. Supplemental waveform and traveltime data were obtained from nearby permanent New Zealand National Seismograph Network (NZNSN) stations, from three stations of the adjacent CNIPSE array (Henrys et al. 2003) and from an array deployed in 1994. The average station spacing over the target area (the central and northern TgVC) is around 5 km (Fig. 2).
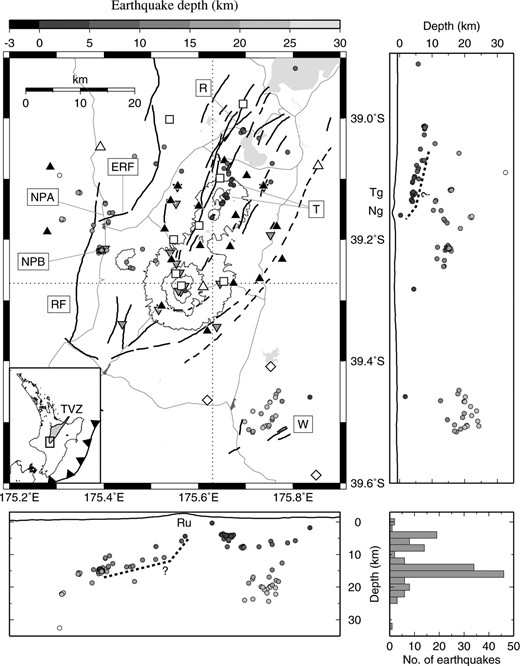
Map and cross-sections of station and final earthquake locations. Stations are denoted as follows: Black triangles—Güralp CMG-40T sensors; White triangles—CMG-3T sensors; White squares—vertical component NZSN stations (further stations located north and northeast of this map were also used); Inverted grey triangles—stations of the 1994 deployment; White diamonds—CNIPSE stations. Earthquake cluster labels are: R—Rotoaira cluster; T—Tongariro cluster; NPA—National Park Village cluster A; NPB—National Park Village cluster B; W—Waiouru cluster. Thick black lines denote faults (dashed lines are inferred faults) two of which are labelled: RF—Raurimu Fault; ERF—Eastern Raurimu Fault. Dotted lines mark location of topography profiles shown in cross-sections. 500-m topography contours are shown around the TgVC volcanoes from 1250–2750 m. Major roads are also shown. Dashed lines in the cross-sections mark the inferred brittle-ductile transition (see Section 4.5). Lower right panel: histogram of number of earthquakes versus depth.
The best 155 local earthquakes were selected after application of several criteria, namely distance to the closest observation (<1.5 × the hypocentral depth), number of high quality P observations (>8) and open azimuthal gap (<180°). At the extreme north of the array several events with open azimuths of 180–200° were included in order to improve ray coverage.
P-wave arrival times were picked on vertical components and S-wave arrivals on horizontal components in an attempt to avoid mispicks. Consequently no S-wave picks are used from the vertical component NZNSN stations in the TgVC. Signal-to-noise ratios for the local earthquake data set were very high despite the prevalent surface volcaniclastics and P-wave arrivals could routinely be picked to within one sample (0.01 s for temporary stations, typically 0.025 s for permanent stations). The presence of P-wave coda and converted phases inevitably causes slightly greater uncertainties in picked S-wave arrival times but the mean uncertainty is nonetheless below 0.1 s. The final arrival time data set comprises approximately 3000 P and 1100 S picks.
2.2 Analysis
The choice of initial reference model in local earthquake tomography (LET) is a critical one (e.g. Kissling et al. 1994). In this study a minimum 1-D model is derived using the VELEST program, which simultaneously inverts arrival times for 1-D velocity structure, station corrections and hypocentres (Kissling et al. 1994). After performing several tests (convergence of different input 1-D velocity models, recovery of perturbed hypocentres and station corrections) the minimum 1-D model is considered to be well-resolved from 2 to 20 km depth (Fig. 3). Above and below this depth interval ray paths are predominantly subparallel and hence provide little constraint on velocity.
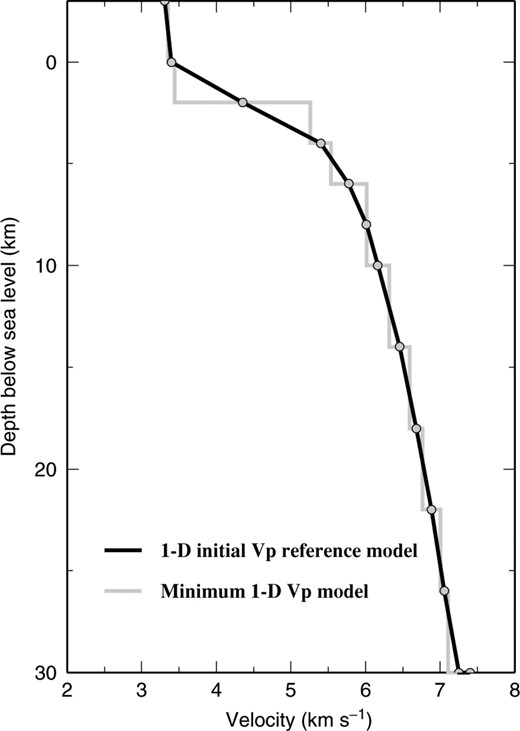
Minimum 1-D P-wave velocity model and 1-D initial reference P-wave velocity model used as starting model for the 3-D tomography.
The minimum 1-D P-wave velocity model is broadly similar to that obtained by Hurst & McGinty (1995) in the same region. Velocity increases rapidly downwards to around 4 km depth and then more slowly down to the limit of resolution at about 20 km depth. Station corrections are almost all small (<0.3 s) with exceptions only at stations with few observations. All station corrections are in good agreement with the surface geology. A linear interpolation of the minimum 1-D P-wave velocity model is used as the 1-D initial reference model in the 3-D Vp tomography (Fig. 3).
Simul2000 (Thurber & Eberhart-Phillips 1999), a relatively recent addition to the Simulps family of tomography programs (Thurber 1983, 1993), is used to perform the 3-D LET via an iterative, damped least-squares inversion. The inversion for Vp uses a graded inversion scheme (Eberhart-Phillips 1990, 1993). This approach commences with a coarsely parameterized velocity model and proceeds to successively finer models, extra nodes being added where resolution tests indicate they are justified. The final output (velocity model, relocated hypocentres, calculated traveltimes) from each such parameterization is used as input to the subsequent (finer) parameterization. For each parameterization it is necessary to choose a suitable damping value for the inversion. The approach of Eberhart-Phillips (1986) is followed, that is, a series of inversions using a wide range of damping values is performed and a trade-off curve of data variance (data misfit) versus solution variance (model complexity) is obtained. A suitable damping value provides a good fit to the data without requiring too complex a model.
The 3-D grid was centred on 39.2°S, 175.6°E with x and y positive to the west and north, respectively. Depth nodes were set at −3, 0, 3, 6, 9, 12, 16, 20, 25, 30 and 100 km below sea level. The −3, 30 and 100 km depth layers were held fixed in each inversion as they lay outside the resolvable depth range of this data set (these layers are nevertheless necessary to maintain the stability of the ray tracer). Initially a coarse horizontal grid was used with nodes spaced every 15 km. Following resolution tests additional nodes at 10 km spacing were added in the central ±30 km of the model. The resolution of this medium parameterization was then probed and extra nodes were placed every 4 km in the well-resolved central ±20 km of the model. This fine parameterization represents the end point of the graded inversion. Resolution tests show that no finer grid could be justified with the available data set. The final 3-D Vp model provided a 59 per cent reduction in data variance compared to that of the initial 1-D reference model.
An alternative strategy for the Vp inversion is to use a single-step inversion. In this approach the final parameterization from the graded inversion is used, but with the 1-D initial reference model as the starting velocity model. Although a similar fit to the data was obtained using this single-step method the final 3-D velocity model was more complex than that obtained using the graded inversion approach. We therefore select the smoother final 3-D model output by the graded inversion as our preferred final 3-D Vp model.
Following the approach of Foulger et al. (1995), Husen et al. (2000) and Haslinger (1998), we invert for Vp/Vs using the final 3-D Vp model output by the graded inversion and an initial Vp/Vs ratio of 1.70 (as calculated from a Wadati diagram of S-P versus P traveltimes). This approach ensures that in well-resolved areas Vp/Vs is free to take the most appropriate value consistent with the data. Conversely, in areas of poor resolution Vp/Vs retains a reasonable value, consistent with the average of the data set under consideration. The final 3-D Vp/Vs model yielded a 48 per cent reduction in data variance compared to the initial 1-D model with a fixed Vp/Vs ratio of 1.70.
2.3 Resolution
Several measures of resolution are commonly used in assessing the reliability of tomographic models. These fall into three main categories: (1) ray-derived measures; (2) resolution matrix-derived measures and (3) measures based upon the recovery of synthetic input models. No single measure of resolution provides an unambiguous indication of whether a particular part of a model is well-resolved. Each type of measure has strengths and weaknesses and all must be examined to gain as full an appreciation as possible of the resolution of a tomographic model.
A good first impression of resolution can be obtained simply from a plot of the ray paths used in the inversion (Fig. 4). It is clear from Fig. 4(a) that high numbers of crossing P rays are present in the central area of the TgVC. High resolution in the Vp model may therefore be expected here. Conversely, P rays around the edge of the TgVC are predominantly subparallel with little cross-firing. These areas will be subject to considerable smearing, and resolution near the periphery of the Vp model is, therefore, likely to be poor.
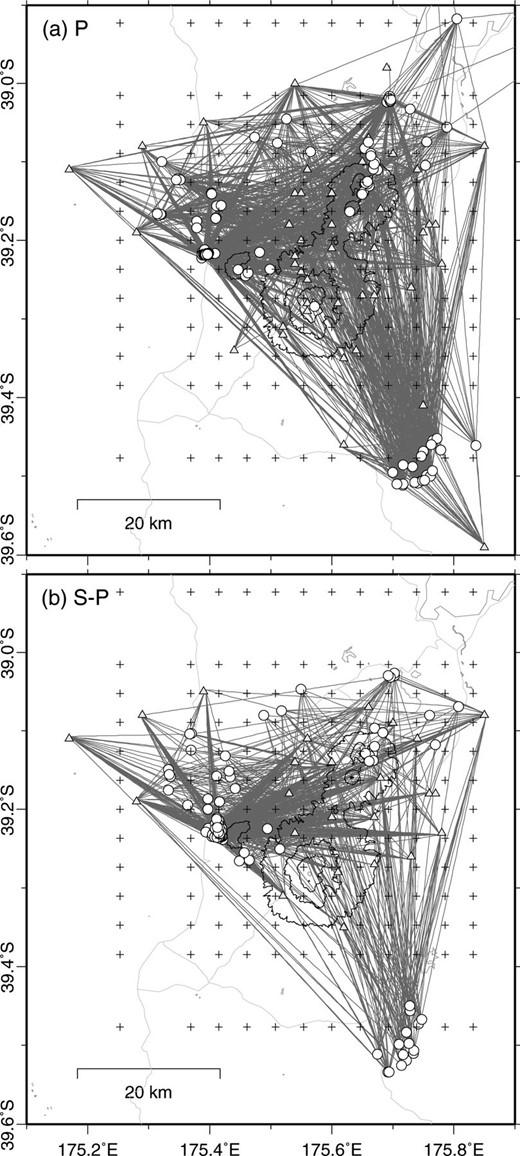
Ray path coverage for (a) Vp and (b) Vp/Vs inversions. White triangles denote stations, white circles denote epicentres (note that epicentres for S-P are shifted due to the inclusion of S information). Crosses denote the positions of nodes of the velocity model.
For S-P ray pairs the coverage is much poorer. This is largely because no S picks from vertical component stations were made. Reasonable numbers of crossing rays are present only in the northern TgVC and so high resolution in the Vp/Vs model may be expected to be restricted to this area.
In order to examine the resolution more quantitatively ray-derived measures such as hit count and derivative weighted sum (DWS, Toomey & Foulger 1989) are useful. The hit count simply gives the number of rays passing a given node of the model. DWS is more informative as it weights rays according to their distance from a node. However, neither of these measures takes account of the directions in which the rays are travelling.
The full resolution matrix describes the influence that each node of the velocity model has on every other node. In an ideal case this matrix would be an identity matrix, indicating that the velocity at every node is independently resolved (i.e. independent of the velocity values at all other nodes). However, the deficiencies of real data sets, the introduction of damping to the inversion and the approximation of linearity made in solving the inverse problem inevitably lead to departures from this ideal case. A further problem is that the resolution matrix is far too large to be easily visualized. The resolution matrix diagonal elements (RDE) provide a simplified view of the full resolution matrix. However, they contain no information on the amount of smearing prevalent in the model. Toomey & Foulger (1989) and Michelini & McEvilly (1991) introduced the spread function, a sum of the elements in each row of the resolution matrix weighted by distance from the diagonal element. The spread function for a given node gives a good indication of the extent to which that node is independently resolved. However, no information is preserved about the directionality of a set of rays passing a node, nor about the position of the centre of resolution which, in the presence of smearing, may not coincide with the position of the node. Spread values in the horizontal plane of our final Vp model are shown in Fig. 5 (those in the north—south and east—west planes may be viewed online).
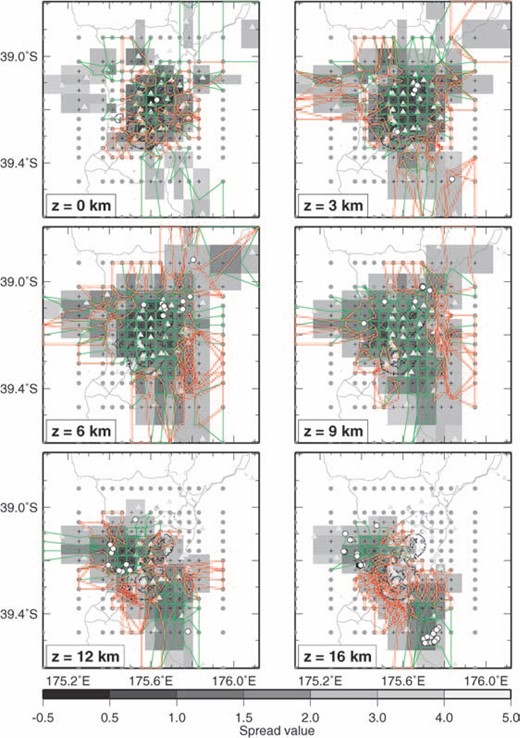
Spread values and resolution contours for the final 3-D Vp model. Compact resolution contours are marked in green, broader contours in red.
Resolution contours (Reyners et al. 1999), also termed smearing contours, address this issue by providing a visual display of the smearing around a node. A row of the resolution matrix describes the dependency of the diagonal element node on every other node within the model. For, say, a 60 per cent resolution contour, the row of the resolution matrix is examined and the points at which the resolution falls to 60 per cent of the RDE are noted. These points are then translated into distances, measured from the node under examination towards the surrounding nodes. The line connecting these points then forms the resolution contour. Compact resolution contours which do not extend beyond adjacent nodes are desired. However, it should be remembered that the choice of the resolution contour percentage is somewhat arbitrary. Typical values used range from 50∓70 per cent (Reyners et al. 1999; Sherburn et al. 2003), with lower percentages indicating higher resolution. In this study 60 per cent resolution contours are used. Those calculated in the horizontal plane of the final Vp model are shown in Fig. 5 (resolution contours in the north-south and east-west planes are viewable online). It is critical to inspect resolution contours in three orthogonal planes in order to identify nodes with significant smearing. For example, in the southeast of our model a fan of subparallel P rays emanates from a cluster of seismicity (Fig. 4a). In both the horizontal and east-west planes the resolution contours in this area indicate little smearing. Only in the north-south plane is the large degree of smearing evident. Failure to examine the resolution contours in all three planes could have led to this area of the model being erroneously assessed as well-resolved.
A problem common to all of the above resolution measures is that they provide only relative measures of resolution, i.e. no absolute threshold values exist above which resolution can be deemed satisfactory for all LET data sets. The problem then is to decide what values indicate high resolution for the data set under consideration. One approach to solving this problem is to compare areas of good recovery from synthetic tests with the above resolution measures. Commonly employed synthetic tests include chequerboard tests, spike sensitivity tests (Spakman & Nolet 1988) and characteristic model tests (Haslinger 1998). The different synthetic tests employ similar methodologies. Firstly a synthetic anomaly model is created. Next the forward problem is solved and a synthetic traveltime data set is calculated using the same source-receiver distribution as in the real data set. Gaussian noise is usually added to these synthetic traveltimes at a level equivalent to the estimated noise in the real data. Finally the synthetic traveltimes (plus noise) are inverted in an attempt to recover the synthetic anomaly model.
In the Vp inversion of this study a close correspondence was found between (a) areas with DWS >50 (viewable online), spread function <2 and compact resolution contours, and (b) areas of good recovery of synthetic models. Together these results provide a firm indication of which parts of the model volume are reliably resolved, and hence which features may be safely interpreted. For example, Fig. 6 shows the recovery of a synthetic chequerboard input model. The pattern of anomalies is well recovered in the central and northern TgVC down to the 9-km-depth layer. Recovery in the 12-km-depth layer is considered fair and deeper layers are not well recovered. Within the central ±12 km of each layer the amplitude recovery is reasonably good. Recovered anomalies of magnitude >4.5 per cent are common in the 3, 6 and 9 km depth layers. Larger amplitudes >5 per cent are recovered at a few nodes in the 0-km-depth layer, perhaps as a result of vertical smearing from lower layers. In the 12-km-depth layer recovered amplitudes are smaller, at best around 4.3 per cent, indicating a lack of resolution at this depth. Spike sensitivity and characteristic model tests show good recovery in similar areas and are viewable online.
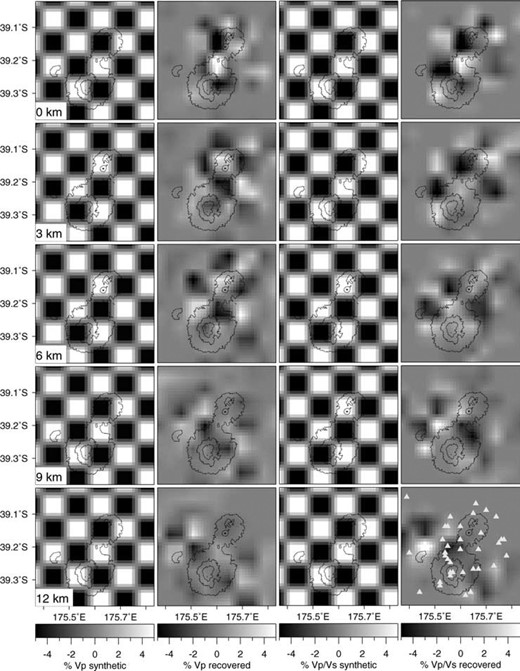
Chequerboard test of the tomographic models. Synthetic input anomalies are ±5 per cent in magnitude and 2 × 2 × 2 nodes in spatial extent.
Consideration of all of the above measures of resolution suggests that we may regard the central ±12 km of the Vp model (i.e. the central and northern TgVC) down to the 9 km depth layer as well-resolved. Amplitudes in this part of the model are reasonably reliable except in one or two isolated parts of the near-surface where slight overestimation is possible. Resolution in the 12-km-depth layer is best described as fair with significant smearing and underestimated amplitudes likely.
Assessment of the resolution of the Vp/Vs model was made in the same way as for Vp. Initially the spread function values, the DWS and a simple chequerboard test (Fig. 6) indicated reasonably good resolution. However, analysis of resolution contours and poor recovery of spike sensitivity and characteristic models revealed a high degree of smearing. The resolution of the Vp/Vs model is, therefore, considered to be fair at best. This is due to several factors including the lower number of S—P ray pairs, the higher uncertainty in S picks and the lower number of stations used. The Vp/Vs model is accordingly omitted from the interpretation.
3 Results
D Vp structure
Two prominent low-velocity volumes are observed in the Vp model beneath Ruapehu and Ngauruhoe volcanoes (Figs 7 and 8). The Ngauruhoe low-velocity volume (Profile 4, Fig. 8) appears to be centred on the volcanic vent and diminishes in magnitude between the 6 km (△Vp = −9 per cent) and 9-km-depth layers. In contrast the Ruapehu low-velocity volume (Profile 2, Fig. 8) appears to be asymmetric, with a steep western edge beneath the presently active Crater Lake vent on the summit and a gently sloping eastern edge underlying the eastern flank of the volcano. This apparent asymmetry may however, be partly a consequence of lower resolution beneath the western flank of Ruapehu (note the lack of crossing rays in this area in Fig. 4). The low-velocity volume reaches a magnitude of −8 per cent in the 6-km-depth layer and decays to −3 per cent in the 9-km-depth layer.
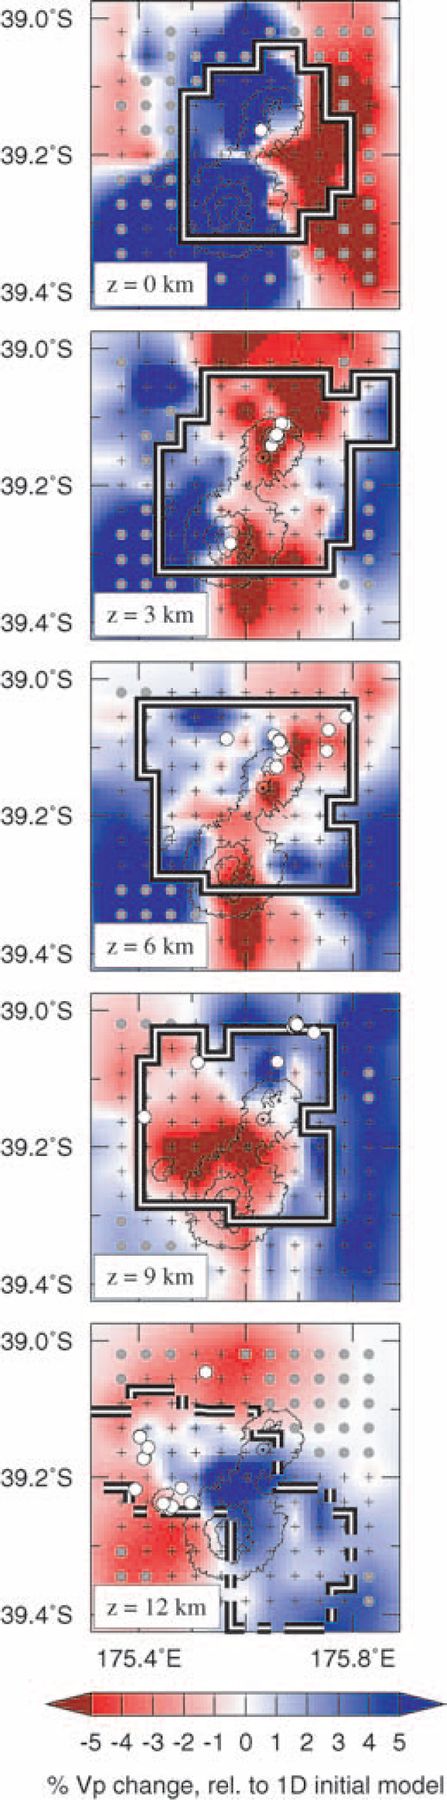
Percentage Vp anomalies of final 3-D model. The thick black/white line shows the area considered to be well-resolved (dashed line indicates fair resolution). Grey circles show nodes held fixed during the finely-parameterized (i.e. final) step of the graded inversion.
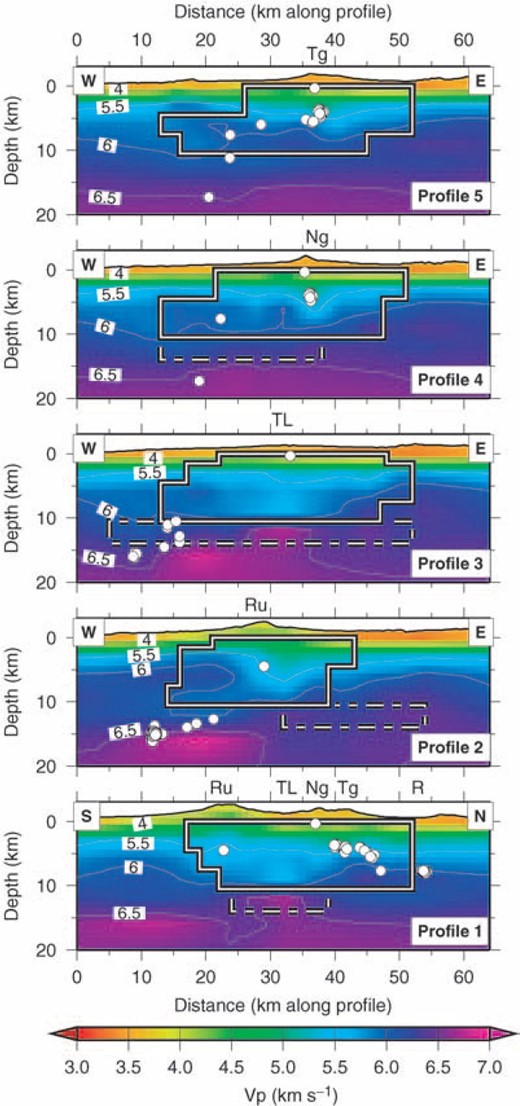
Profiles of absolute Vp of final 3-D model. Thick black/white lines outline areas of good resolution (dashed line shows limit of fair resolution). Abbreviations as in Fig. 1.
Smaller low-velocity volumes are observed beneath the active Tongariro volcano and the extinct vents at Tama Lakes (Figs 7 and 8). At Tongariro the low-velocity volume is strong (−9 per cent) at 3 km depth but disappears by around 5 – 7 km depth (Profile 5, Fig. 8). A less pronounced, 15 km broad low-velocity volume is observed beneath Tama Lakes, again starting at around 3 km depth and petering out at 5 km depth (Profile 3, Fig. 8).
The 0-km-depth layer is characterized by areas of large amplitude positive or negative velocity anomalies. As discussed previously the amplitudes of these near-surface anomalies may be slightly exaggerated. High velocities correlate with the volcanic cones, whilst low velocities are observed at shallow depth under the Rangipo desert in the east of the TgVC (Fig. 7).
3.2 Distribution of relocated earthquakes
The general pattern of seismicity is apparent in Fig. 2 with shallow seismicity (<10 km depth) in the north and deeper seismicity in the west (around 15 km depth) and southeast (around 20 km depth).
The following prominent features are also observed in the final 3-D hypocentre data set (Fig. 2):
- (a)
two clusters of particularly high seismicity located near National Park Village, northwest of Ruapehu (clusters NPA and NPB in Fig. 2);
- (b)
three lineations of seismicity, two at Waiouru and one at Tongariro (W and T respectively, in Fig. 2) and
- (c)
a swarm of earthquakes which occurred over a period of a few hours on 2001 February 10, at the northwest edge of Lake Rotoaira (R in Fig. 2).
4 Discussion
Before interpreting tomographic models it is prudent to remind oneself of some of the limitations inherent in the tomographic ‘imaging’ process. First and foremost it is essential to remember that the common practice of referring to the absolute velocities calculated in a tomographic model is somewhat misleading. The velocities obtained by LET are not absolute in a literal sense because of several factors, including: the linearization approximation made at the outset of the tomography; the restriction that final velocities have to remain linearly close to the 1-D initial reference model; the use of a velocity model with only a finite number of parameters; the inevitable averaging of velocities over considerable volumes; and the introduction of damping into the inversion. Clearly the final velocities at any particular point in a tomographic model are not absolute in a strict sense. They should rather be thought of as being the absolute velocities viewed through the series of ‘filters’ listed above.
Secondly, and following on from the first point, the seismic velocities from a tomographic model provide only a limited constraint on the nature of the crust. Independent constraints from other measurements are extremely important and a good interpretation should take account of all available data.
Thirdly, the limits of resolution must be borne in mind at all times. In this study resolution varies both spatially and in depth beneath the TgVC (see Section 2.3).
The following discussion focuses both on features of the LET models and on the distribution of seismicity in and around the TgVC.
4.1 Ruapehu
The large low-velocity feature apparent in the Vp model beneath Ruapehu may be explained in several ways. Firstly, the low velocities may indicate the presence of remnant partial melt from the 1995, 1996 and 1998 eruptions. However, this explanation has two weaknesses. Recent eruptions at Ruapehu were relatively small in volume (approximately 0.1 km3) and are thought to have been supplied through a narrow (tens of metres wide) conduit—any melt remaining beneath Ruapehu is unlikely to be distributed over a sufficiently large volume to account for the large lateral extent of the low-velocity volume observed. Furthermore, eruptions over the last 2 ka have all occurred through Crater Lake (Gamble et al. 2003), situated at the summit of the volcano, yet the low-velocity volume is centred beneath the eastern flank of Ruapehu. It is, therefore, considered implausible that a leftover body of hot and/or partially molten rock could fully account for the large low-velocity volume observed.
A second possibility is that velocities have been lowered by hydrothermal alteration. From geological observations this process is known to have occurred at Ruapehu in the past (Gamble et al. 2003) and is known to be occurring at present beneath Crater Lake. Hydrothermal circulation down to depths of 5–8 km is common further north in the TVZ (Bibby et al. 1995), albeit within rhyolitic volcanic systems. However, it is not clear how hydrothermal alteration beneath Ruapehu could account for the large lateral extent of the low-velocity volume observed, especially in view of the recent focus of activity beneath the summit.
A further possible source of the low-velocity volume is downwarping of the crust due to the topographic load imposed by the Ruapehu edifice. Circumstantial evidence for this downwarping is provided by the orientations of faults in the area (Fig. 2). Faults to the west, south and east of Ruapehu are oriented tangentially to the volcanic massif. A slight difficulty for this explanation is that the thickest part of the low-velocity volume does not quite coincide with the summit of Ruapehu (i.e. the greatest load). However, as previously mentioned this apparent asymmetry may be a consequence of low resolution beneath the west flank of Ruapehu.
A final explanation is that thick sequences of volcanic products deposited around Ruapehu cause the low-velocity volume observed. Donoghue et al. (1999) summarize the geology of the ring plain around Ruapehu as consisting of thick sequences of andesitic tephras overlying and interbedded with lahar deposits, lava flows, debris avalanche deposits, fluvial and aeolian sands, and exotic rhyolitic tephras erupted from the central TVZ. Successive episodes of deposition, burial and compaction of material from all these sources may have built up a thick deposit of low-velocity material around Ruapehu. However, it is not clear whether this mechanism could produce the full 6 km thickness of the low-velocity volume observed.
Clearly no single explanation is able to explain fully the low-velocity volume beneath Ruapehu, but it is possible that each has played a part in its formation. The low-velocities observed directly beneath the Crater Lake area may be indicative of hot or partially molten rock remaining from the last eruptive episode. This would certainly be consistent with the seismic ‘soft centre’ and petrological open system models for Ruapehu, which propose a hot conduit underlying Ruapehu Crater Lake, incapable of significantly impeding the ascent of fresh magma. A degree of hydrothermal circulation in and around the conduit would be expected in such a system, serving to broaden the low-velocity volume.
The most reasonable explanation for the low velocities beneath the eastern flank of Ruapehu is considered to be successive, preferential deposition of volcaniclastics to the east due to the prevailing westerly wind direction. This probably occurs in conjunction with continuing downwarping of the crust due to the increasing volcanic load at the surface. Some evidence for this downwarping is seen in the gentle westward dip of the 5.5 km s−1 contour east of Ruapehu (Profile 2, Fig. 8). A possible weakness of this explanation is the lack of evidence in the Vp model for downwarping to the west of Ruapehu, although this may simply be an artefact of the aforementioned low resolution in this area (Figs 7 and 8).
4.2 Ngauruhoe
Similar arguments may be applied to the low-velocity volume observed beneath Ngauruhoe. However, the comparatively young age of Ngauruhoe (2500 yr old) and the slow rate at which the crust flexes (a few centimetres per year) imposes a limit on the amount of downwarping possible.
The most likely explanation for the low-velocity volume beneath Ngauruhoe is a complex of hot or partially molten material left over from previous eruptions. Such an explanation would agree with the interpretation of Hobden et al. (1999) of the extreme chemical variability of different lavas from Ngauruhoe indicating a network of interconnected conduits and small magma chambers.
The possible role of hydrothermal circulation is not clear at Ngauruhoe. Although the seismically active geothermal system beneath Tongariro is only some 2 to 3 km distant, Ngauruhoe exhibits very little seismicity. This aseismicity may indicate that no active geothermal system is present beneath Ngauruhoe. However, some active geothermal systems are known to be largely devoid of seismicity, e.g. Ohaaki (Sherburn et al. 1990, 1993; Bryan et al. 1999). We, therefore, cannot eliminate the possiblity that an active geothermal system underlies Ngauruhoe and that our 6-month recording window may simply have coincided with a low level of seismic activity.
Regardless of the present situation hydrothermal circulation has certainly occurred in the TgVC in the past (Nairn et al. 1998). It is possible that a volume of rock that was hydrothermally altered during previous eruptive episodes may underlie Ngauruhoe and contribute to the low-velocity volume observed.
4.3 Tongariro
Several active geothermal vents are found on Tongariro. The low-velocity volume observed at shallow depths is, therefore, most easily attributed to the presence of a hot source body for the geothermal field and to the effects of hydrothermal alteration. A broad area of low Vp/Vs ratios is also observed at shallow depths beneath Tongariro (Fig. 10). As discussed previously, this feature cannot be regarded as being particularly well-resolved. Nevertheless, low Vp/Vs is at least consistent with the presence of water within a geothermal system.
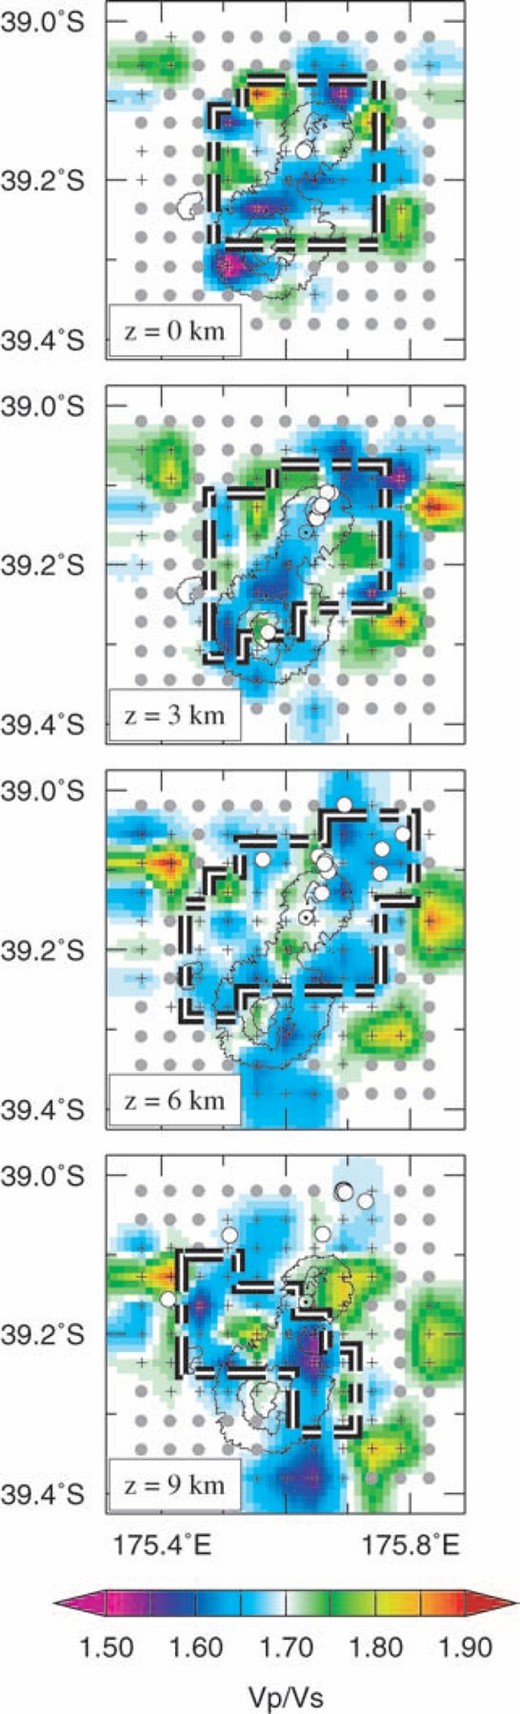
Final 3-D Vp/Vs model. Symbols as described in Fig. 7. Note that the resolution in each depth layer may only be considered fair at best. Any interpretation of Vp/Vs anomalies is therefore unwarranted in this study.
The broad lateral extent of the low-velocity volume at Tongariro may be explained in a similar way to that at Ruapehu. Large-scale collapses of the Tongariro complex, known to have occurred in the past (e.g. Lecointre et al. 2002), fall-out from eruptions and a degree of downwarping of the crust offer ready explanations for the low-velocity volume observed.
4.4 Tama Lakes
Volcanic activity from the Tama Lakes is known to have occurred as recently as the 10 ka Pahoka-Mangamate sequence (Nairn et al. 1998; Nakagawa et al. 1998). Nairn et al. (1998) cite unpublished results of gravity and audiomagnetotelluric profiles over the Tama Lakes as indicating that a ‘dense “basement” high underlies the volcanics beneath Tama Lakes area, associated with a conductive anomaly at ∼1–1.5 km depths. It is underlain by material of lower conductivity—interpreted as Mesozoic greywacke. Because the Tama Lakes area forms part of a positive magnetic anomaly, the conductive material cannot be due to present day high temperatures or magma at depth. The conductive anomaly is interpreted as formed by alteration/mineralization associated with magmatic intrusions, and/or increased permeability due to fracturing’. These results are compatible with the low-velocity region observed in this study, although the low seismic velocities extend somewhat deeper than the dense/conductive anomaly.
4.5 Earthquake locations
The earthquake locations in this study are the most accurate yet obtained within the TgVC. Several features of the local seismicity warrant further discussion.
Firstly, the two clusters of earthquakes located near National Park Village (NPA and NPB on Fig. 2) may not originate on the large, normal Raurimu fault. From a comparison with the composite focal mechanism of cluster A of Hurst & McGinty (1999), it seems likely that cluster NPA originates on the Eastern Raurimu Fault (ERF).
Cluster NPB is probably equivalent to cluster B of Hurst & McGinty (1999), although cluster NPB is located a few kilometres northeast of cluster B and is more tightly focussed at 15 km depth. Hurst & McGinty present an oblique-normal composite focal mechanism for their cluster B that may be interpreted in two ways. Firstly, the fault plane may be the nodal plane oriented approximately parallel to the Raurimu Fault. Alternatively, the fault plane may be the nodal plane oriented approximately east-west. On the basis of the distribution of seismicity neither possibility may be eliminated. Although the latter possibility does not correspond to any previously mapped fault, Hurst & McGinty did state that of the two possibilities the east-west fault plane was consistent with the better located events. In the absence of any other evidence for this fault, however, they concluded that the events were probably associated with movement on the Raurimu Fault. The possibility nevertheless cannot be discounted that the east-west fault exists but has not been mapped, perhaps because it lacks a surface expression.
Should earthquake clusters NPA and NPB occur on small eastward branches of the Raurimu Fault, rather than on the main fault itself, the potential for large magnitude earthquakes here in the future may be lower than has hitherto been expected. However, further seismic experiments, particularly with improved station coverage to the west of the Raurimu Fault, will be needed in order to localize these clusters on particular faults.
Secondly, three lineations of seismicity are observed. The first two occur near Waiouru (marked W on Fig. 2) with hypocentres concentrated between approximately 12 and 24 km depth and strikes subparallel to nearby mapped faults. The seismicity in this area has been closely examined by Hayes et al. (2004) using double-difference relocation, focal mechanisms and a technique to determine the stress tensor orientation. We note that the locations of Hayes et al. are in reasonably close agreement with those presented in this study. Hayes et al. concluded that the seismicity near Waiouru is of tectonic origin and is due to fluid movement within a critically loaded fault zone.
The third lineation extends downward and northward, from very shallow depth beneath Ngauruhoe to around 9 km depth beneath the northern flank of Tongariro (marked T on Fig. 2). Again this lineation has a subparallel trend to nearby mapped faults. It is possible that these earthquakes also occur on an unmapped fault, perhaps again lacking a surface break.
Further analysis of these features of local seismicity is necessary in order to understand more fully the relationship between earthquakes, faulting, regional extension and volcanic activity in and around the TgVC.
A further notable feature of the distribution of seismicity is the lack of events beneath Ruapehu and Ngauruhoe. This aseismicity was also observed prior to and during the 1995–1996 eruptions of Ruapehu, when only a few deep (>1 km beneath Crater Lake) volcano-tectonic earthquakes were recorded (Sherburn et al. 1999). This lack of precursory seismicity has been interpreted by several authors (e.g. Hurst & McGinty 1999; Sherburn et al. 1999) as being indicative of a ‘soft centre’ beneath Ruapehu, that is, a volume of weak rock through which ascending magma can pass relatively easily and relatively aseismically. This model is in good agreement with ‘open system’ petrological models of Ruapehu and models derived from tephrostratigraphy of the TgVC as a whole, in which rapid ascent of magma from depth is a key feature (Nairn et al.1998; Nakagawa et al. 1998; Gamble et al. 2003).
In contrast, during the volcanically active period of 1976–1983 the New Zealand Volcanological Record and Latter (1981a) reported several volcano-tectonic earthquakes at depths ranging from the summit of Ruapehu down to approximately 20 km depth. If these locations are genuine then the present day lack of deeper seismicity may indicate a large-scale change in the thermo-mechanical regime of the crust beneath the TgVC. However, earthquake locations within the TgVC during this period were not well constrained (e.g. Latter 1978, p. 32) due to a lack of instrumentation and a consequent lack of information about the velocity structure of the area. Detailed comparisons between the seismicity presented in this paper and historical seismicity are, therefore, unwarranted and evidence for any large-scale changes to the TgVC system must be treated with caution.
Seismicity recorded during this study reinforces the ‘soft centre’ and ‘open system’ models. Earthquakes are located at shallower depths beneath both Ruapehu and Ngauruhoe (see cross-sections of Fig. 2), perhaps indicating a shallowing of the brittle-ductile transition beneath these volcanoes. This is consistent with our interpretation of low seismic velocities being at least partly due to the presence of hot or partially molten material beneath Ruapehu and Ngauruhoe. It should be borne in mind however, that only a 6-month snapshot of seismicity is available from the START array. Improvements to the permanent network in the area will allow more accurate routine hypocentral depth calculation and will shed light on whether this apparent shallowing of the brittle-ductile transition is a long-term feature.
4.6 Conclusions
We present 3-D tomographic models and accurately located local seismicity for the TgVC. The Vp structure of the upper-mid crust is well-resolved in the central and northern TgVC, revealing large low-velocity volumes beneath Ruapehu and Ngauruhoe and smaller ones beneath Tongariro and Tama Lakes. These features are shown to be consistent with previous petrological and seismological models for the TgVC volcanoes.
Our interpretation of the tomographic models is summarized in cartoon form in Fig. 11. The main features of our interpretation are:
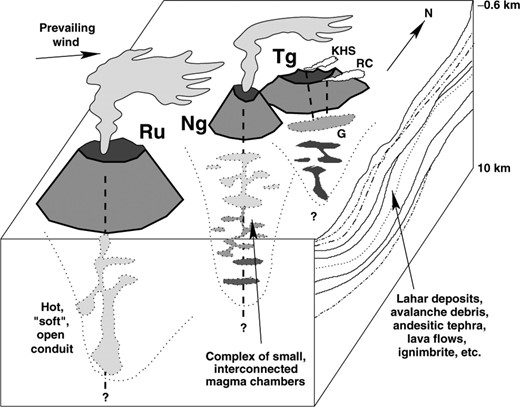
Cartoon of our interpretation—see text for explanation. Abbreviations are as follows: Ru—Ruapehu; Ng—Ngauruhoe; Tg—Tongariro; KHS—Ketetahi Hot Springs; RC—Red Crater; G—Geothermal source body.
- (a)
the conduit beneath Ruapehu remains hot from previous eruptions, providing little resistance to ascending magma, and is largely aseismic;
- (b)
a complex of small, interconnected magma chambers lies beneath Ngauruhoe;
- (c)
a shallow, hot body underlies Tongariro feeding the active geothermal system there and
- (d)
thick, low-velocity deposits from various volcanic sources form the ring plains around Ruapehu and Tongariro.
Local seismicity is largely restricted to two clusters west of Ruapehu, possibly originating on small eastward branches of the large Raurimu Fault, and lineations near Waiouru and under Tongariro. The crust immediately beneath Ruapehu and Ngauruhoe is almost aseismic, possibly indicating a shallowing of the brittle—ductile transition.
Acknowledgments
We thank Steve Sherburn and Regina Lippitsch for countless valuable discussions. DR was supported by the Natural Environment Research Council (NERC). Fieldwork was funded by the Royal Society and NERC. Instruments were loaned by SEIS-UK. Supplementary data were generously made available from: (a) the New Zealand National Seismograph Network, operated by IGNS, New Zealand; (b) the CNIPSE array, by Martin Reyners (IGNS) and Graham Stuart (Univ. Leeds, UK) and (c) the 1994 and 1995 seismometer deployments in the TgVC, by Tony Hurst (IGNS). Logistical support was provided by staff at the Wairakei offices of IGNS. We thank all those who provided assistance in the field: Alex Brisbourne and Paul Denton (SEIS-UK); Tony Harrison and Jenny Maresh (Univ. Cambridge); Steve Sherburn (IGNS); Michael Bourne (Univ. Leeds) and Wanda Stratford (Victoria Univ., Wellington). We also thank all those who kindly gave permission for us to deploy seismometers on their land, particularly Harry Keys at the Department of Conservation in Turangi, local Maori iwi, Rangipo Prison and several farm owners. This paper benefitted from helpful reviews by Tony Hurst (IGNS) and an anonymous reviewer. Department of Earth Sciences, Cambridge, contribution number 7946.
References
Supplementary Material
The following supplementary material is available for this article online:
Figure S1.DWS for the fine Vp inversion. The DWS= 50 contour is marked with a white/orange contour.
Figure S2. Spread values and north—south resolution contours for the fine Vp inversion. Compact contours are marked in green, contours which spread beyond adjacent nodes are marked in red. Topography is shown along the top of each crosssection.
Figure S3. Spread values and east—west resolution contours for the fine Vp inversion. Compact contours are marked in green, contours which spread beyond adjacent nodes are marked in red. Topography is shown along the top of each cross-section.
Figure S4. Input spike model for the fine Vp inversion. Anomalies are ±5 per cent in magnitude relative to the 1-D initial reference model and extend over two nodes in each direction. Adjacent anomalies are separated in each direction by 2 unperturbed nodes.
Figure S5. Recovered spike model for the fine Vp inversion. The input anomalies are recovered well in the 3 and 6 km depth layers. Vertical and horizontal smearing is generally of low amplitude compared to the input and recovered anomalies.
Figure S6. Input characteristic model for the fine Vp inversion. This model is constructed by changing the strikes and polarities of the anomalies observed in the fine Vp model.
Figure S7. Recovery of the characteristic model for the Vp inversion. Within the central ± 12 km of the model recovery is reasonably good in the 3- 6- and 9-km-depth layers.
This material is available as part of the online article from https://doi.org/10.1111/j.1365-246X.2005.02716.x
